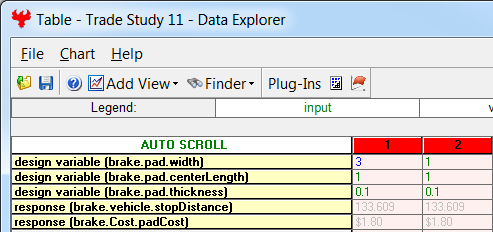
Table Page
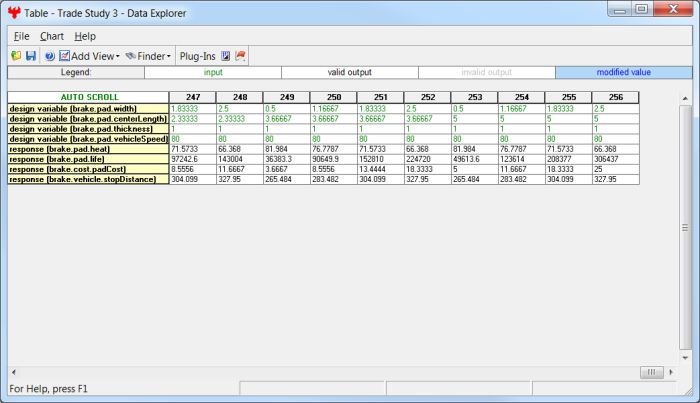
The Table page displays trade study data in a tabular form. It is the default window that is present for all trade studies. Cells are shaded differently depending on the associated variable's state. Input variables are shown with green text, valid values are displayed with black text, invalid values are displayed with gray text, and modified values are displayed with blue text. From the table it is possible to view and edit all values in your trade study and even to add and remove whole runs.
Viewing Data with Large Variable Names
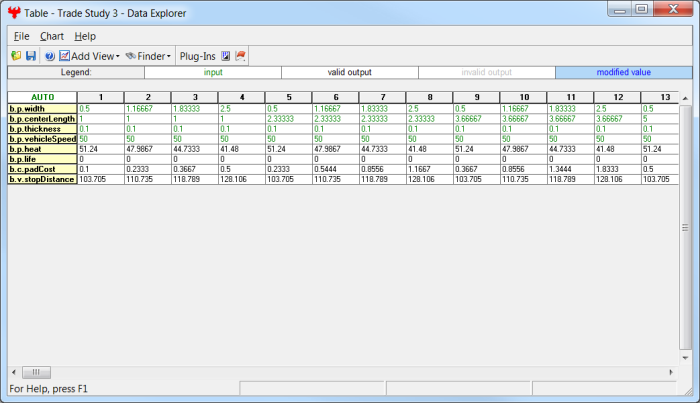
Often times your variable names will be quite large, which can make viewing data in the table troublesome. In addition to being able to simply resize the column with the variable names in it, you could also either transpose your rows and columns, or shorten your variable names. To transpose your rows and columns, select the Transpose option from the Chart menu. This switches your rows and columns, as shown below:
![]()
The other way is to use the Shorten Variable Names option from the Chart menu. This leaves the last part of a variable's name unchanged, but reduces all other parts of a variable's name to one letter. For instance, the variable name "Brake.Caliper.width" becomes "B.C.width". To undo the shortened naming scheme, select Show Full Variable Names from the menu.
Sorting Runs
Often times after your data is gathered, you'd like to sort it in accordance with some variable. To do so, select the variable you'd like to sort by in the table (which highlights all its associated cells in the table), then select either Sort Ascending or Sort Descending from the Chart menu. If at some point you'd like to sort again by the run numbers, you can select any variable and select Sort By Run # from the Chart menu.
Searching the Data
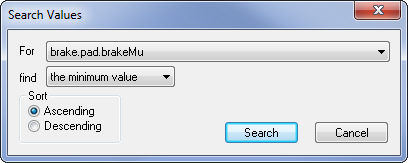
In large data sets, it's fairly common that you will want to find particular configurations where a given variable is equal to some value, within some range, etc. To do this, select the variable of interest, then choose Search Values... from the Chart menu.
There are several options for your search:
- Minimum Value - finds the runs in the data set where said variable is the least
- Maximum Value - finds the runs in the data set where said variable is the greatest
- Value Equal To - finds the runs in the data set where said variable is equal to the specified value. If no runs are found to be equal, nothing is selected.
- Value Closest To - find the runs in the data set where said variable is closest to the specified value.
- In Range - finds the runs in the data set where said variable is within the specified range
- In Percent Range - find the runs in the data set where said variable is within the specified percentage of the specified value
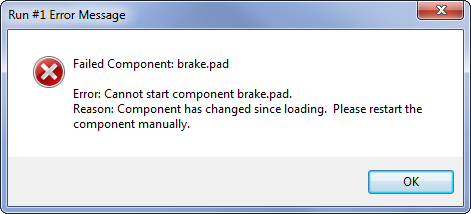
Handling Failed Runs
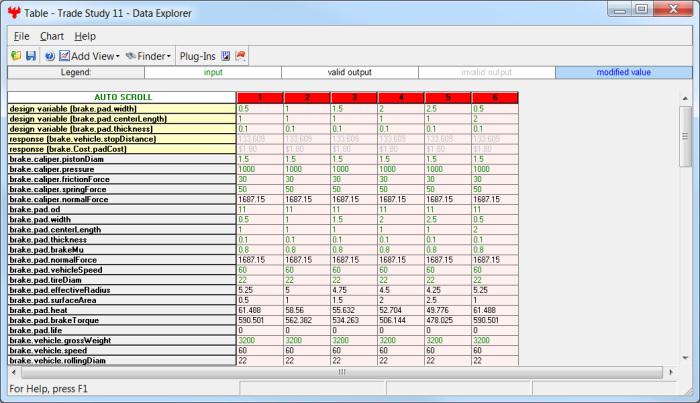
It's not uncommon for one or more runs in a trade study to fail for some reason. When this happens, the run's header will have a red background.
You may view the error message by selecting the run, then selecting the View Error from the Chart menu.
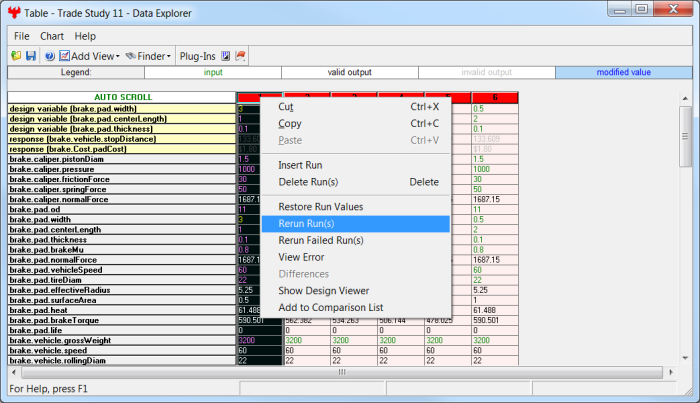
The error may be something easy to fix, where perhaps altering one or more design variables and rerunning the particular run will yield a valid run. In this case, you can manually edit the data in the table by double-clicking the cell in the table you'd like to change, then entering the new value. When done, the modified cell's value will be displayed in blue font.
You may then resimulate by selecting the run in the table, then selecting the Rerun Run(s) item from the Chart menu.
Adding and Removing Runs
There may be times when you'd like to trim down your data set, perhaps in order to view differences between a handful of runs, get rid of failed runs, etc. To do so, you may select the run you wish to remove, then select the Delete Run option from the Chart menu. Likewise, there may be times when you would like add a run to your data set. You can do this by selecting the run you'd like the your new run to be inserted after, then choosing the Insert Run option from the Chart menu. After creating a new, blank run, you'll probably want to populate it with some initial values, then modify a few of the values. To accomplish this, you'd first select another run whose values you'd like to copy, select Copy from the Edit menu to put that run's data on the clipboard, select your blank run, then select Paste from the Edit menu. From there, you may modify your new run's values to produce a different run.
Getting Data into Excel
There may come a time where you'd like to move all of your data into Excel. The easiest way to do this is to select all the data in your table, which can be done by selecting the upper leftmost cell in the table, then selecting Copy from the Chart menu. At this point, your data is on the clipboard, and you can paste it into Excel by selecting the appropriate starting cell, then selecting Paste from the Edit menu.
See Also Data Explorer