Developer Environment
Integrated Development Environments (IDEs) can help you develop your own custom SysML v1 or SysML v2 delegate modules much more easily and error free than if you were to use a simple text editor and Command Prompt. If you choose to use an IDE, you can configure it however you like, and with whatever build tool you like. To get you started, here are some recommendations for configuring the following IDEs to use Gradle:
You should have already installed Java, Gradle, and your IDE before following these steps.
Eclipse
Import your delegate project
- In Eclipse, select File > Import.
- If the Welcome page pops up, you can just click .
- Select Gradle > Existing Gradle Project and then click .
- to your delegate source code directory and click .
- If this is the first time you are importing a Gradle project,
click Configure Workspace Settings....
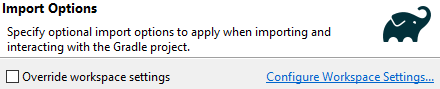
Figure 3: Importing a Gradle project into Eclipse
Follow these substeps to configure Gradle:- If you are familiar with using a Gradle wrapper then you can select it and configure your Gradle project accordingly. Otherwise, you should just to your Local installation directory of Gradle (the top-level gradle-#.# directory, not the bin directory).
- Leave your Gradle user home empty to use the default (C:\Users\<username>\.gradle).
- to your Java home
(e.g., C:\Program Files\Java\jdk-17).
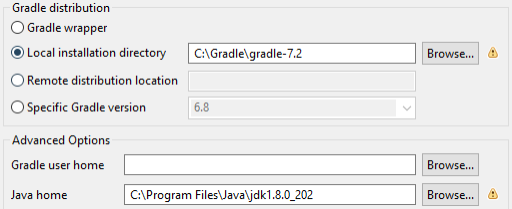
Figure 4: Recommended Gradle configuration in Eclipse
- Click .
- Click .
Attach Java API Documentation
For Eclipse, examples of enabling Java API Documentation automatically with Gradle are provided in the "samples" folder within the install directory. Use the following table to determine which sample to explore depending on your target SysML version.
| Target SysML Version | Sample build.gradle File Location |
|---|---|
| SysML v1 | <BEE Install Directory>/samples/build/build.gradle |
| SysML v2 | <BEE Install Directory>/samples/sysml2/build/build.gradle |
Configure content assist
If you would like to modify Eclipse's default Java code suggestions, follow these steps:
- Select Window > Preferences.
- In the left sidebar, select Java > Editor > Content Assist > Advanced.
- Select your preferred options. You probably want to select both Java Proposals and Java Type Proposals.
- Click .
Create a debug configuration
Attach the Eclipse debugger by creating a debug configuration.
- Select Run > Debug Configurations....
- In the left sidebar, select Remote Java Application and click the New Configuration button in the upper left.
- Name the configuration and to your delegate module project.
- Leave the
Hostas localhost and set thePortto 5005. - Click .
After you have created the configuration and attached with it once, you can attach in the future by just clicking the button again.
IntelliJ IDEA
Import your delegate project
- In IntelliJ IDEA, select File > Open or, if IntelliJ IDEA opens to a Welcome page, just click .
- Select your delegate source code directory and click .
- Click and, if given the choice, choose a window to open your project in.
- If IntelliJ IDEA reported a Sync error when opening your project,
follow these substeps to configure Gradle:
- Select File > Settings.
- In the left sidebar, select Build, Execution, Deployment > Build Tools > Gradle.
- Leave your Gradle user home empty to use the default (C:\Users\<username>\.gradle).
- If you are familiar with using a Gradle wrapper, then you can Use Gradle from a 'gradle-wrapper.properties' file, but you will need to configure your Gradle project for that. Otherwise, you should just Use Gradle from the Specified location of your Gradle installation (the top-level gradle-#.# directory, not the bin directory).
- Select your Gradle JVM, adding a new JDK if necessary
(e.g., C:\Program Files\Java\jdk-17).
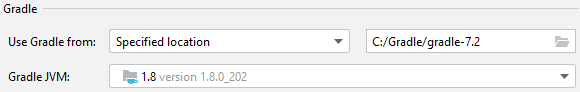
Figure 5: Recommended Gradle configuration in IntelliJ IDEA
- Click .
Attach Java API Documentation
To see Java API Documentation for the module libraries inside Intellij IDEA, follow these steps:
- Select File > Project Structure to open the Project Structure window.
- Select Modules in the left sidebar
- Select the main module. Usually this would be a module called main that can be found after expanding the module with the same name as the project.
- Navigate to the Dependencies tab in the right sidebar.
- Find the API library you want to attach documentation to. See the chart below for attachable libraries.
- Double-click the API library to open the Configure Module Library window.
- If you do not see a JavaDocs folder, press the button in the top left of the Configure Module Library window to open a directory picker prompt.
- Navigate to the corresponding documentation directory for the API library you are seeking documentation for. Highlight the corresponding directory
and press . After selecting the directory, make sure that you choose JavaDocs and press .
Even if the directory chosen is correct, IntelliJ will not know what kinds of files it contains and prompt for clarification via a popup dialogue.
Reference the table below for the correct Java API Documentation folder to select for each library:
API Libraries Java API Documentation Folders - moxie-api
- moxie-delegates
<BEE Install Directory>/documentation/javadoc/bee - moxie-stk-utilities
- moxie-stk-delegates
<BEE Install Directory>/documentation/javadoc/stk - com.agi.mbse.sysml2.api
<BEE Install Directory>/documentation/javadoc/sysml2 - You should now see a "JavaDocs" folder attached to your module library. Press to exit the Configure Module Library window, then press to exit the Project Structure window.
Older versions of Intellij IDEA have issues resolving paths that include spaces, which can affect one's ability to attach documentation via the above steps. To circumnavigate this issue, try copying the Java API Documentation folders into paths that do not contain spaces and follow the above steps again.
Configure code completion
If you would like to modify IntelliJ IDEA's default Java code suggestions, follow these steps:
- Select File > Settings.
- In the left sidebar, select Editor > General > Code Completion.
- Select your preferred options. You probably want to select both Basic Completion and Type-Matching Completion.
- Click .
Attach the debugger
In IntelliJ, you do not need to set up any debug configurations. If the SysML Client is in Debug Mode, you can attach by following these steps:
- Select Run > Attach to Process....
- Select
debug port: 5005.
VS Code
Install required extensions
- In VS Code, click the Extensions icon on the left.
- Using the search bar, find and install the following extensions:
- Restart VS Code.
Import your delegate project
- In VS Code, select File > Open Folder.
- Select your delegate source code directory and click .
- Click .
- Select View > Command Palatte... (or press ).
- Search for and select Preferences: Open User Settings (JSON).
- Add the following lines to the JSON file, replacing the paths to your Java or Gradle homes if necessary (make sure to use forward
slashes in these paths):
"java.jdt.ls.java.home": "C:/Program Files/Java/jdk-17",
"java.import.gradle.home": "C:/Gradle/gradle-7.2",
"java.import.gradle.wrapper.enabled": false, - Restart VS Code.
Create a debug configuration
VS Code requires a separate debug configuration for each project.
- In VS Code, select the Run and Debug icon on the left.
- Click create a launch.json file.
- In the Select Debugger shortcut menu, select Java.
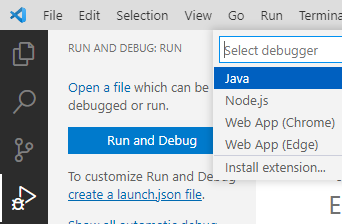
Figure 6: Creating a debug configuration in VS Code
- Select Run > Add Configuration.
- In the list of available configurations, select Java: Attach to Process.
- Delete the
Launch Current Fileconfiguration settings from launch.json.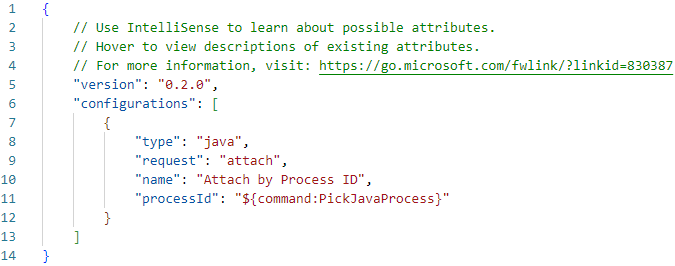
Figure 7: Recommended debug configuration in VS Code
- Save launch.json.
Attach the debugger
You can attach the VS Code debugger by following these steps:
- Select Run > Start Debugging.
- Select the process with
debug port: 5005.