Debugging State Machines
The SysML Client offers the ability to pause execution on certain states and transitions using breakpoints. To set a breakpoint on an element, first open the diagram on the Models tab. Then simply click on the desired element to see it highlighted to indicate a breakpoint has been set. The "animation delay" also allows you to artificially slow down the diagram animation speed to watch the transitions occur even if the simulation executes quickly. By default, there is no rendering delay and the visualization of the state behaviors proceeds at the same pace as the underlying calculations and processing time of whatever other tools are participating in the simulation.
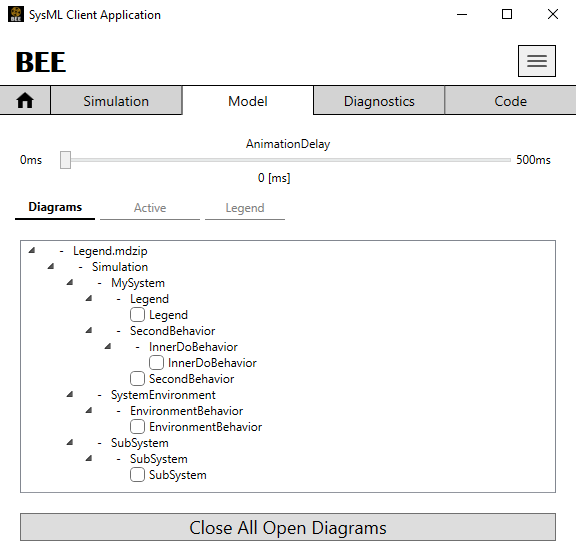
Figure 1: Model Tab showing available diagrams
The Diagrams view shows ALL the activations of elements while the Active view shows only the activations for a specific runtime instance, with the names showing up in the window title as shown in the model tree. You can always click on the model tree to re-focus each window to ensure you're looking at the correct instance.
Behavior Diagrams Across Dynamic Instances
As part of a SysML model, different types may or may not have behaviors. Each type may even have multiple behaviors, or those behaviors might even contain subordinate behaviors used inside other behaviors, as is the case with Do Behaviors. This means that, while each type only has one "classifier" behavior that it initiates when instantiated, each instance may end up running multiple behaviors each with their own diagrams. Moreover, multiple instances may share the same type, even though they have distinct identities and values.
While looking at diagrams in a SysML authoring tool can provide insight into traceability and other important systems engineering tasks,
simulating a complex system can create a lot of new information quickly as the interactions between systems and subsystems unfold.
To track the behavior of individual instances, you will need to understand which instance
is in which states at any given time. This is why the SysML Client
provides an Active model view during execution to distinguish between all the different SysML behavior sessions associated with the different
instances during execution. This applies equally to instances that were created from InstanceSpecifications
or that were spawned at runtime using the
DelegateInstanceManager
injectable dependency inside a Custom Delegate Module.
In contrast, the Diagrams view shows a more static look at the diagrams from the SysML model, regardless of whether a simulation is running. However, during a simulation, the Diagrams view will show ALL the activations of states and transitions across ALL the instances. This can be helpful in many cases, but can also be confusing in cases where there are a lot of instances that share the same type. For instance, when designing satellite constellations, drone formations, or scheduling for an autonomous taxi service, it's important to understand what all the individual instances of these types are doing at any given time.
Color Coding
The SysML Client uses various colors to indicate the different status of elements during execution. When opening diagrams, the colors in the model tree indicate whether there are any breakpoints set in the diagram and whether that diagram is currently active. You can see a description of the meaning of these colors in the Legend under the Models tab, as shown below in Figure 2-4 below.
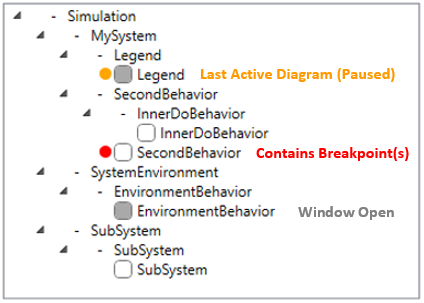
Figure 2: Color Legend for the "Diagrams" model tree
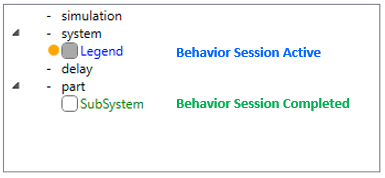
Figure 3: Color legend for the "Active" model tree showing the active sessions for instances created during execution
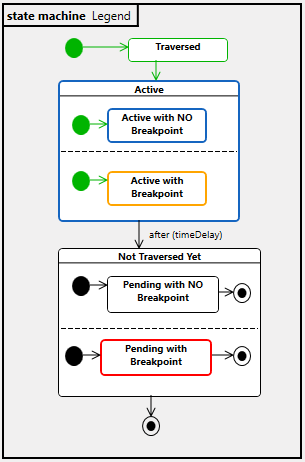
Figure 4: Debug Mode in the SysML Client Tool
STK Toolbar
The SysML Client Plugin includes a toolbar in STK. This toolbar allows you to run the currently selected simulation, stop a running simulation, or continue or step through a paused simulation. This allows you to control the execution of simulations through a simple toolbar without taking up screen space with the simulation view open in the SysML Client.

Figure 5: STK Toolbar with simulation controls
-
 The Start Simulation button is enabled when a simulation is selected. When you click it, it
will start whichever simulation is currently selected.
The Start Simulation button is enabled when a simulation is selected. When you click it, it
will start whichever simulation is currently selected.
-
 The Stop Simulation button is enabled when a simulation is running. When you click it once, it attempts to
gracefully stop the simulation. If you click it again while the simulation is being canceled, it will abort the simulation.
The Stop Simulation button is enabled when a simulation is running. When you click it once, it attempts to
gracefully stop the simulation. If you click it again while the simulation is being canceled, it will abort the simulation.
-
 The Continue Simulation button is enabled when a simulation is running and paused at a breakpoint.
When you click it, it will continue the simulation until another breakpoint is reached or the simulation is finished.
The Continue Simulation button is enabled when a simulation is running and paused at a breakpoint.
When you click it, it will continue the simulation until another breakpoint is reached or the simulation is finished.
-
 The Step Simulation button is enabled when a simulation is running and paused at a
breakpoint. Each time you click it, it will step forward through the next set of instructions and the simulation will remain paused.
The Step Simulation button is enabled when a simulation is running and paused at a
breakpoint. Each time you click it, it will step forward through the next set of instructions and the simulation will remain paused.