For this tutorial, you will use an HDF5 (.h5) file that you converted Using MATLAB to Convert Volumetric Data from .csv to HDF5 File (.h5) Tutorial or an HDF5 file from the STK install. The Using MATLAB to Convert Volumetric Data from .csv to HDF5 File (.h5) Tutorial shows how to easily convert large data files to the .h5 file type as well as properly format object properties within the .h5 file.
Problem Statement
Given an .h5 file containing latitude, longitude, altitude, corresponding temperature data, and a variety of volumetric object properties, you will use the file as a means of displaying temperature data over time as a 3D graphical overlay in STK.
Solution
Given a set of volumetric data properly formatted for use in STK, you will manually import the .h5 file into STK, configure the object properties for the volumetric object, and view the data as displayed over time in the 3D Graphics Window. The following short steps will be taken to complete this:
- Load the .h5 file into a volumetric object in STK.
- Set appropriate scenario and graphical properties.
- Animate the scenario.
Loading Your Data to STK
Now that you have your .h5 file properly created with your weather and volumetric object data, you can import it into STK for volumetric analysis.
- Launch STK.
- Create a New Scenario named VolumetricWeatherData.
- Set the Start time to 11 May 2015 16:00:00.000 UTCG and the Stop time to 13 May 2015 16:00:00.000 UTCG.
- Click OK to create your scenario.
- Open the scenario properties and navigate to the Units page.
- Using the drop-down, change the CurrentUnit type for Temperature to Celsius (degC) and click OK.
- Open the Insert Default Objects drop-down and double-click Volumetric to create a new Volumetric object. Rename this object to VolumetricWeather.
- Open the VolumetricWeather object properties and enable Load Grid and Computed Data.
- Click the ellipses button (.…), navigate to the .h5 file created using the Using MATLAB to Convert Volumetric Data from .csv to HDF5 File (.h5) Tutorial. If you did not create a file using the conversion process, you can use my_volumetricExampleScenarioDynamicWeatherData.vmc.h5 file located in <STK install folder>/Help/stktraining/samples.
Change Graphical Properties for 3D Dynamic Visuals of Weather Data
With your .h5 file properly loaded, you can now change some of the graphical properties of the volumetric object to properly display your data.
- Open the VolumetricWeather properties and navigate to the 3D Graphics-->Attributes page.
- Enable Smoothing and Shading and ensure the quality is on High.
- Open the Grid page and disable Show Grid.
- Open the Volume page and enable Spatial Calculation levels. Disable Immediately Update Graphics.
- At the lower section of the Volume page, near where the Show Fill Levels box is checked, click the drop-down next to Value and choose degC.
- At the bottom of the Volume page, click Insert Evenly Space Values….
- In the Insert Evenly Spaced Values pop-up window, change the Start Value to -18.15, the Stop Value to 16.85, and the Step Size to 5. Under Ramp Colors change the Start to Blue and the Stop to Red. Click the Create Values button.
- Inside the Fill Levels box you should see eight evenly spaced values with correspondingly graded colors. Under the %”column, which denotes the value’s translucency level, change the values to the ones shown below.
- Go to the 3D Graphics Legends page and enable Show Legend. Change the Title to Temperature (C).
- Click Apply and then click OK.
| Value (C) | Translucency % |
|---|---|
| -18.15 | 10 |
| -13.15 | 25 |
| -8.15 | 60 |
| -3.15 | 57 |
| 1.85 | 55 |
| 6.85 | 35 |
| 11.85 | 35 |
| 16.85 | 48 |
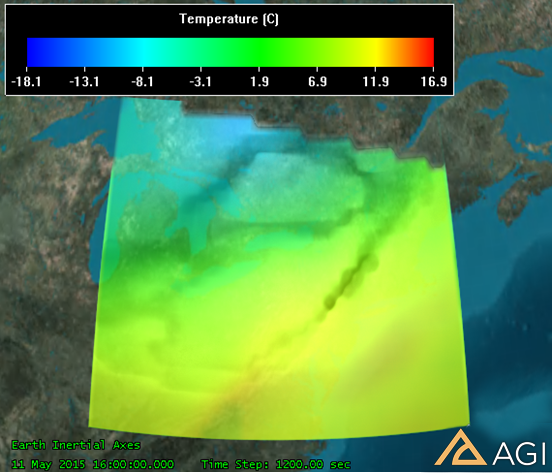
What you should see now is your weather data displayed in very effectively expressive 3D Graphics.
Animating Your Dynamic Data
With your data finally loaded into STK on a volumetric object, and the graphics now properly displayed, you can animate your scenario to exhibit the data as it changes over time.
- Open your VolumetricWeatherData scenario properties.
- Go to the Basic-->Time page, and enable Stop at Time.
- Change the Step Size to 1200 seconds and click OK.
- Right click the VolumetricWeather volumetric object and click Zoom To. Orient your camera view normal to the projected area.
- Press the Start animation button.
As you can see, the data displayed changes over time. The graphics of the Volumetric object should now convey what looks like actual changing temperature patterns as they move across the continent.
Try moving the camera around so that it looks at the southern edge of the volume, as shown below.
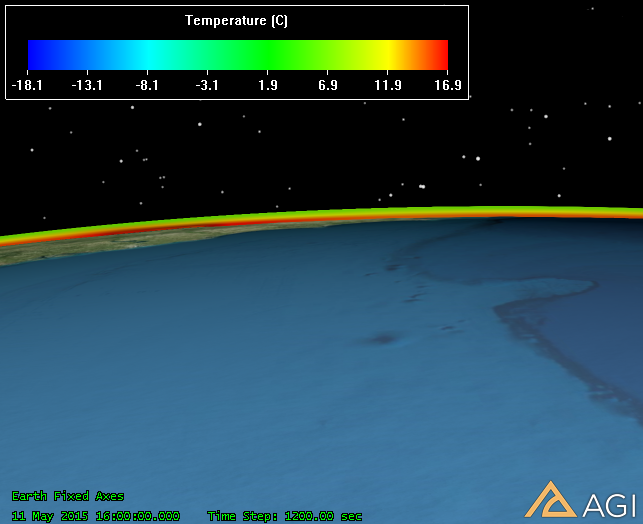
Notice the pronounced temperature difference between altitudes of the volume. Try moving around the camera to look at and animate the underside of the volume.
There are a number of demonstrative and explanatory graphical attributes you can change about volumetric objects, including the Grid, different Volume Boundary and Fill Level gradient scales, and Cross Sections – explore some of these properties to better understand their uses.
 Visit AGI.com