STK Professional and Coverage.
The results of the tutorial may vary depending on the user settings and data enabled (online operations, terrain server, dynamic Earth data, etc.). It is acceptable to have different results.
Problem Statement
You are performing a training exercise on mountainous terrain in the vicinity of Mount St. Helens. You need to determine the positional uncertainty of the GPS being used to pinpoint the forward air controllers location.
Solution
Using STK and Coverage, build an STK scenario that can be used to examine the accuracy of your navigation solution within a specified area so that you can plan and execute safe strikes when using GPS munitions. Using this analysis, you will determine if there are any areas at any times where the position accuracy is so unacceptable that forward air controllers could be in danger from friendly fire.
This exercise can be completed without an Internet connection. However, for the scenario to be accurate, you need updated STK databases (GPS) and GPS uncertainties. You should install the STK Plugin NavFiles which is found on the STK install disk. This plugin allows you to determine GPS satellite outages and uncertainties. It is used in the lesson.
Create a New Scenario
Create a new scenario using the default analysis time period.
- Launch STK (
 ).
). - Click the Create a New Scenario (
 ) button.
 - Enter the following in the New Scenario Wizard:
- When you finish, click OK.
- When the scenario loads, click Save (
 ). A folder with the same name as your scenario is created for you in the location specified above.
 - Verify the scenario name and location and click Save.
- If you plan to complete the L3 quiz at the end of the tutorial, turn off the Terrain Server.

| Option | Value |
|---|---|
| Name | NavAccuracy |
| Location | C:\Documents and Settings\<user>\My Documents\STK 11 (x64)\ |
| Start | 3 Jul 2016 16:00:00.000 UTCG (NOTE: accept defaults if you are not completing the L3 quiz) |
| End | + 1 day (NOTE: accept defaults if you are not completing the L3 quiz) |
Save Often.
Add Terrain and Imagery
If you have an Internet connection, you only need to add analytical terrain. Microsoft Bing Maps can be used for imagery. If you don't have an Internet connection, you can use imagery that is located in the STK install area.
- If you have previously created a *.pdtt file from the hoquiam-e.dem terrain data file during STK Comprehensive training or other advanced training, you can enable it for analysis.
- If you have not already created the *.pdtt file, we have provided one for you.
- Bring the 3D Graphics window to the front.
- Click the Globe Manager (
 ) icon or click the View menu and select Globe Manager.
 - Click the Add Terrain/Imagery (
 ) button in the Globe Manager ()
 - Click the ellipsis (
 ) button and navigate to <STK install folder>/Help/stktraining/imagery.
 - Select StHelens_Training.pdtt and click Open.
- When prompted Use Terrain for Analysis, click Yes to enable terrain for analysis.
- If you don't have an Internet connection, in Globe Manager, click the Add Terrain/Imagery () button to add imagery.
- Select Local Files on the left.
- Open the Path: pull down menu and select All Image Directories.
- Select the file St Helens.jp2 and click Open.
- Right-click on the *.pdtt file in the Globe Manager and select Zoom To.
Define Your Analysis Area
Using an area target object, outline the area of operations so that you can concentrate your analysis in that area.
- Bring the Insert STK Objects (
 ) tool to the front.
 - Insert an Area Target (
 ) object using the Area Target Wizard method.
 - Change Name: to ExerciseArea
- Using the Area Target Wizard (), choose Area Type: Pattern.
- Click the Insert Point button four (4) times then enter the following coordinates:
- Click OK to accept the changes to the Area Target Wizard.
- Open the NavAccuracy's () properties (
 ).
). - Select the 3D Graphics - Global Attributes page.
- Change the Surface Lines On Terrain: option to On.
- Click OK.
- Bring the 3D Graphics window to the front.
- Open the 3D Graphics window properties.
- On the Details page, locate the Label Declutter field and turn on Enable.
- Click OK.
- Zoom To ExerciseArea.
- Zoom out a bit until you see the exercise area outline.
| Latitude | Longitude |
|---|---|
| 46.15 deg | -122.3 deg |
| 46.15 deg | -122.1 deg |
| 46.3 deg | -122.1 deg |
| 46.3 deg | -122.3 deg |
Draw lines on 3D Graphics window
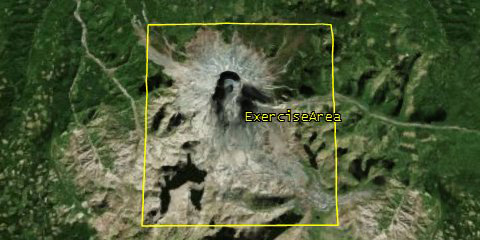
Area target
Model the GPS Network
The forward air controllers are equipped with a hand held GPS unit that they can use to determine their position when calling in a strike. The GPS munitions communicate with the GPS network to determine position information. Let’s model the network now.
- If you are not completing the L3 quiz, insert the GPS Constellation using the Load GPS Constellation (
 ) method.
 - Bring the Insert STK Objects tool () to the front.
- Choose Satellite (
 ) as your object to be inserted and select Load GPS Constellation () in the Method pane.
 - Click Insert.
- Click Close to dismiss the Insert From Satellite Database panel.
- Download the almanac_sem_week0880_147456.al3 GPS alamanc file from AGI's FTP Site:
- Insert a Satellite using the GPS Almanac method.
If the Insert STK Objects window is not already up, open it using Insert - New...
If you plan to complete the L3 quiz at the end of the tutorial, retrieve the appropriate archive almanac file (almanac_sem_week0880_147456.al3) from AGI's FTP Site and insert the GPS satellites from that file.
Coverage Definition
You know what your region-of-interest is: the area target. You need to tell STK to use that area as your region-of-interest. Use a coverage definition object to define an analytical area that will limit itself to user defined boundaries.
- If the Insert STK Objects window is not already up, ope it using Insert - New...
- You need a Coverage Definition (
 ) object and Figure Of Merit (
 ) object to proceed. If you don't have them in the Insert STK Objects tool, Click Edit Preferences... and add them.
 - Choose Coverage Definition () as your object to be inserted and select Define Properties in the Method pane.
- Click Insert.
- Right-click on the Coverage Definition in the Object Browser, select Rename and rename Rename the Coverage Definition to PosAccCov.
- Set the following options on the Basic - Grid page:
- Grid Area of Interest
- Grid Definition
- Click OK.
| Option | Value |
|---|---|
| Type | Custom Regions |
| Selected Regions... | Exercise Area |
| Option | Value |
|---|---|
| Point Granularity | Distance - 0.5 km |
| Point Altitude... | Altitude above Terrain - default (0 km) |
If it is difficult to see the grid points after following the steps above, change the color of the Coverage Definition object to something brighter (e.g. white).
Constrain Coverage
Your coverage grid is situated in some pretty rugged terrain. In order for your analysis to be accurate, each point in your coverage grid needs to take the local terrain into account when computing GPS network access. Create an object whose constraints can be applied to the points in the coverage definition. Use a facility object as a constraint template.
- Bring the Insert STK Objects tool () to the front.
- Choose Facility (
 ) on the left as your object to be inserted and select Insert Default in the Method pane.
 - Right-click on the Facility in the Object Browser, select Rename and rename the facility ConstraintTemplate.
- Move the ConstraintTemplate inside the boundaries of the area target object, ExerciseArea, using the 3D Object Editing (
 ) tool or by typing in the latitude and longitude values.
 - Use the 3D Object Editing tool to move the facility object inside the boundaries of the area target object.
- Type the latitude and longitude values to move the facility object inside the boundaries of the area target object.
If the Insert STK Objects window is not already up, open it using Insert - New...
 ) button.
The location of the constraints template is unimportant so long as it is somewhere on the terrain within the area target boundary.
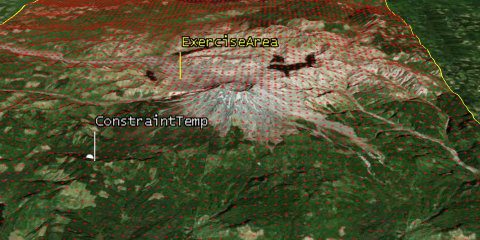
Constraint facility
- Open ConstraintTemplate's () properties ().
- On the Basic - Position page, enable the Use terrain data option for the object's Altitude.
- On the Basic - AzElMask page, svet the following options on t:
- Click OK to apply changes and dismiss the Properties Browser.
- You don't need to see the facility object on the 2D or 3D Graphics windows.
- In the Object Browser, disable the box to the left of ConstraintTemplate to disable graphics for the facility object (ConstraintTemplate).
| Option | Value |
|---|---|
| Use: | Terrain Data |
| Use Mask for Access Constraint | Enabled |
Apply Constraint to the Coverage Definition Object
You have a constraint source and you have a defined coverage area. You need to associate the constraint that you’ve set (facility object) with the points in the grid to which the constraint will be applied.
- Right-click on the Coverage Definition's () object and select Properties.
- On the Basic - Grid page, click the Grid Constraint Options... button.
- Select Facility from the Reference Constraint Class drop-down.
- Enable the Use Object Instance option.
- Select the ConstraintTemplate ().
- Click OK to close the Grid Constraint Options window.
- Click Apply to accept your changes.
Identify Assets
You’ve defined and constrained the area within which you’d like to analyze coverage. The next step is to identify your assets. The GPS satellites are the assets with which you want to assess the quality of your coverage. Prior to assigning the GPSConstellation as your asset, you need to check for any outages.
For the following steps to work, you must have the Navigation Files Plugin installed. Otherwise, skip to Assign the Assets.
If you plan to complete the L3 quiz at the end of the tutorial and don't have the Navigation Files Plugin, download and install the Plugin from https://www.agi.com/product-explorer/default.aspx. Look for the product line with "Arc GIS REST Client, Web Map Services, and Navigation Files Plugins".
The Navigation Files Plugin can bring in GPS satellite outage information and update the satellite interval files to exclude the satellites from your analysis during the outage.
- Right-click on GPSConstellation (
 ) in the Object Browser.
 - Expand the Constellation Plugins option.
- Select the Add GPS Satellite Outages option.
- When the Add GPS Satellite Outage tool appears, in the Select GPS Satellite Outage Data field, click the Download button and wait until you see the message "Satellite Outage Data Loaded".
- If you do not have an internet connection and you plan to complete the L3 quiz at the end of the tutorial, follow the steps below to retrieve and use the Satellite Outage File (SOF):
- In the Apply to Which GPS Constellation? field, ensure the GPSConstellation is highlighted and click Apply.
- Look at the Outage Results Applied field. If there are no outages to apply, it will say "No outages found."
- Click OK to close the Update Complete pop up window and then OK to close the Add GPS Satellite Outages pop up window.
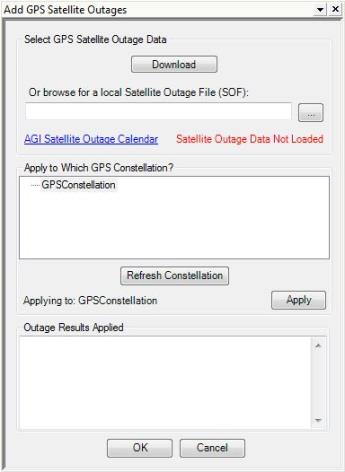
GPS Plugin
If there is an outage, an Interval constraint is added to exclude the satellite for that interval. The interval file will exclude the satellite during the outage time. Now you can assign the GPSConstellation as your coverage definition asset.
Assign the Assets
- Return to the Coverage Definition () object's properties ().
- Select the Basic - Assets page.
- Select GPSConstellation () in the Assets list and click the Assign button.
- Click Apply.
Disable the Automatically Recompue Access option
- Return to the Coverage Definition () object's properties ().
- Select the Basic - Advanced page.
- Disable the Automatically Recompute Access option.
- Click OK to accept changes and dismiss the Properties Browser.
Compute Coverage
Now that the coverage definition is defined, you can compute access to points in the grid.
- Right-click on the Coverage Definition () object in the Object Browser.
- Expand the CoverageDefinition menu.
- Select Compute Accesses.
Navigation Accuracy
Coverage tells you where you have access to GPS satellites from inside the exercise area boundary, but you need to determine just how accurate the GPS position information is at any given time. Uncertainty exists in any navigation solution. You cannot eliminate uncertainty; you can, however, account for it.
- Using the Insert STK Objects tool, choose Figure Of Merit () object on the left in the Attached Objects section and select Define Properties in the Method pane.
- Click Insert...
- Select the Coverage Definition () object in the Select Object dialog.
- Click OK.
- On the Figure Of Merit () object's Basic - Definition page, set the following options:
- Click Apply.
- Click the Uncertainties button to view the Asset Range Uncertainty and Receiver Range Uncertainty for your GPS Satellites.
You may need to add the Figure of Merit object to the Insert STK Objects tool. To do this, click the Edit Preferences button and select it from the New Object tool.
| Option | Value |
|---|---|
| Type | Navigation Accuracy |
| Compute | Maximum |
| Method | PACC |
| Type | Over Determined |
| Time Step | 60 sec |
STK defaults the Asset and Receiver Range Uncertainties to one meter and zero meters. Due to the inherent danger of calling in a strike, the FAC requires actual asset range uncertainties.
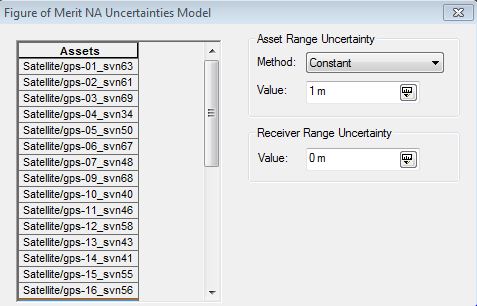
Uncertainties
- Click OK.
Asset Range Uncertainty
The GPS constellation experiences errors in its ephemeris (position in space) and clock data that translate into positioning errors in GPS receivers.
For the following steps to work, you must have the Navigation Files Support Plugin installed and an active Internet connection.
If plan to complete the L3 quiz at the end of the tutorial you need to follow these steps. If you don't have an internet connection within STK, you can retrieve the PSF file at: ftp://ftp.agi.com/pub/Catalog/PSF and navigate to it. Otherwise, skip these steps.
- Right-click on the Figure of Merit () object in the Object Browser.
- Expand the FigureOfMerit Plugins option.
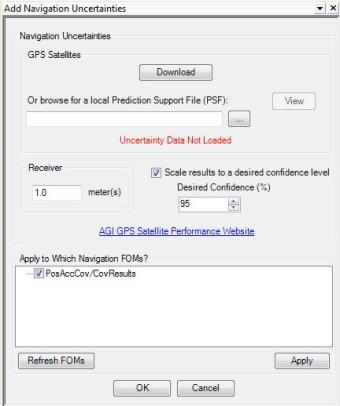
- Select the Add Navigation Uncertaintiesoption.
- Use the Add Navigation Uncertainties Plugin to determine range uncertainties.
- Click the Download button to load the uncertainty data.
- If you do not have an internet connection and you plan to complete the L3 quiz at the end of the tutorial, follow the steps below to retrieve and use the Satellite Outage File (SOF):
- In the Apply to Which Navigation FOMs? field, select the Figure Of Merit object being used in the scenario.
- Click Apply.
- Close the Update Complete window.
- Click OK to close the Add Navigation Uncertainties window.
Navigation Uncertainty tool
Check Your Work
- Right-click on the Figure of Merit's () in the Object Browser and select Properties ().
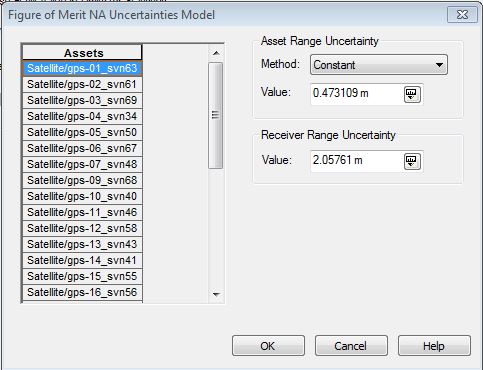
- Click the Uncertainties button on the Basic - Definition page.
If you look in the Asset Range Uncertainty, you will notice the constant value for each satellite has been updated for the PSF file. Also, you can see the Receiver Range Uncertainty Value has been adjusted.
Updated Uncertainties
- Click OK to close the Figure of Merit NA Uncertainties Model window.
- Click OK to close the properties window.
Position Accuracy in a Custom Report
The Grid Stats Over Time report summarizes the minimum, maximum, and average of the figure of merit’s dynamic value over the entire grid as a function of time.
- Right-click on the Figure of Merit in the Object Browser and select the Report & Graph Manager (
 ).
). - Right-click on the Grid Stats Over Time report and select Properties ().
- Select Overall Value by Time - Minimum in the Report Contents list.
- Click the Options... button.
- When the Options window appears, enable Min from the Summary Options field.
- Click OK.
- Select Overall Value by Time - Maximum in the Report Contents list.
- Click the Options... button.
- When the Options window appears, enable Max from the Summary Options field.
- Click OK.
- Click OK to close the Properties Browser.
- Click OK when the warning appears.
- Expand the MyStyles directory and rename the new Grid Stats Over Time report to My Grid Stats Over Time.
- Generate the new My Grid Stats Over Time report.
As you scroll through the report, note the different sections. First is the Coverage properties which simply shows values from the coverage definition object. Next is the FOM properties section. This is a good place to view the asset range uncertainties. Finally, you will see the minimum, maximum, and average uncertainties in meters. Minimum and maximum uncertainty values can be used to define the display of color contours.
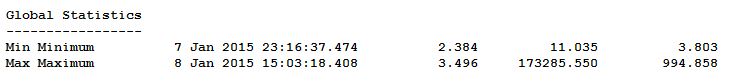
Global Statistics
Your data won't match the Global Statistics data. It is dynamic and changes.
For the purposes of the military exercise, any range uncertainty greater than 10 meters is unacceptable. Minimum and maximum uncertainty values can be used to define the display of color contours.
- Close the report and the Report & Graph Manager.
Contour Graphics
Specify how levels of coverage quality display in both the 2D and 3D Graphics windows using contours graphics. Contour levels represent the gradations in coverage quality and can be displayed for both static and animation values of the figure of merit. Since these values change over the 24 hour period, you'll focus on animation values.
- Right-click on the Figure of Merit's () in the Object Browser and select Properties ().
- Onthe 2D Graphics - Animation page, change the Filled Area - % Translucency to ten (10).
- In the Display Metric field, enable the Show Contours option.
- In the Level Attributes section, click Remove All.
- Set the following options in the Levels field:
- Click the Add Levels button.
- Ensure the Color Method: is set to Color Ramp.
- Set Start Color: to blue and End Color to red.
- Enable Natural Neighbor Sampling.
- Click Apply.
- Click the Legend... button.
- Click Layout... on the Animation Legend for FigureOfMerit window.
- In the 3D Graphics Window field, enable the Show at Pixel Location.
- Click OK to apply changes and dismiss the Layout window, then close the Animation Legend for FigureOfMerit window.
- Return to the 3D Graphics window.
- Animate (
 ) your scenario.
| Option | Value |
|---|---|
| Level Adding - Start | 1 m |
| Level Adding - Stop | 10 m |
| Level Adding - Step | 1m |
During the 24 hour period, you can visualize, based on color contours, how your range uncertainty is changing. Anytime an area turns red, you are at or above your cutoff uncertainty of ten meters.
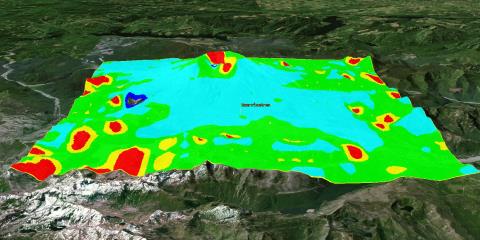
Range Uncertainties
Inspecting Regions & Points
If you know exactly where the FAC is located, you can use the Grid Inspector tool which enables you to focus more closely on a region or point within a coverage grid, furthering your analysis efforts.
- Bring the 2D Graphics window to the front.
- Zoom to (
 ) the exercise area.
 - In the Object Browser, disable the Figure of Merit graphics. This will allow you to see the grid points inside the area target.
- Right-click on the Figure of Merit and expand the FigureOfMerit option.
- Select the Grid Inspector...
- Click on a grid point in the 2D Graphics window. In the Messages field, you will receive Point Location, Point Area, how long the Point is Covered by a maximum number of assets, and the value of Maximum Navigation Accuracy at that location.
- In the Graphs field, click the Point FOM... button.
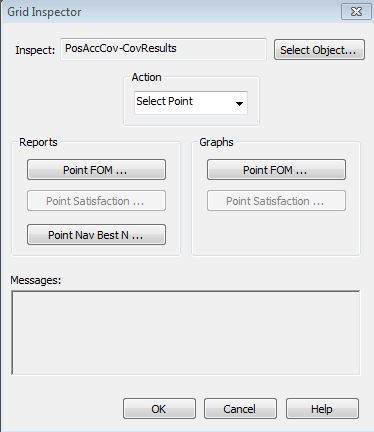
Grid Inspector
This graph is very useful. Let’s say ten (10) meters is your accuracy cutoff for incoming munitions strikes. You simply place your cursor at the tops of any spikes in your graph and you can read the date and time that accuracy is out of limits. The FAC would not call in a strike at this time.
- If desired, try different points.
- When finished, close the graph, Grid Inspector, and the Figure Of Merit object's properties.
Don't forget to save your work!
 Visit AGI.com