STK Professional and STK SatPro.
The results of the tutorial may vary depending on the user settings and data enabled (online operations, terrain server, dynamic Earth data, etc.). It is acceptable to have different results.
Problem Statement
A NASA Earth science satellite, Aqua, was designed to last six (6) years. It was launched in 2002, so it has surpassed its design life, however, it is still doing useful work in space. Since the satellite is still being used, you would like to optimize the efficiency operations performed by the vehicle and on-board equipment. You would like to do some long-term analysis of the potential power generation on-board the satellite.
Your job is to find an accurate way to determine how the solar panel power generation changes throughout the year, specifically at the different solstice and equinox times when the sun is at its most extreme positions. Having this information will help you predict your power budget should the satellite last for many more years.
Break It Down
You have some information that may be helpful. Here’s what you know:
- You need to analyze changes in power over an entire year, with focus on changes in power that occur when the sun is closest or furthest away during that year (the solstice and equinox times).
- Your analysis period will start on the winter solstice 2016 and last until winter solstice 2017.
- The solstice dates for winter 2016 through winter 2017 are as follows:
- The End of Life Power (Peol) from the solar panels on Aqua is approximately 4860 W.
- The area of the solar panels is 67.2 meters.
- Using STK, the sun incident angles for the five previous periods of time have been calculated:
| Solstice | Date | Time (UTCG) |
|---|---|---|
| Spring Equinox '16 | 20 Mar 2016 | 04:30 |
| Summer Solstice '16 | 20 Jun 2016 | 22:34 |
| Fall Equinox '16 | 22 Sept 2016 | 14:21 |
| Winter Solstice '16 | 21 Dec 2016 | 10:44 |
| Spring Equinox '17 | 20 March 2017 | 10:28 |
| Summer Solstice '17 | 21 June 2017 | 4:24 |
| Fall Equinox '17 | 22 Sept 2017 | 20:02 |
| Winter Solstice '17 | 21 Dec 2017 | 16:28 |
| Time (Solstice or Equinox) | Sun Incident Angle (Deg) |
|---|---|
| Spring '16 | 22.13 |
| Summer '16 | 20.60 |
| Fall '16 | 22.46 |
| Winter '16 | 31.05 |
Solution
Create a new STK scenario and perform power analysis using the Solar Panel tool.
Model the World!
The first thing you need to do is create a scenario. You will be interested in the potential power over the course of five seasons beginning with the winter solstice of 2016 which will occur on December 21, 2016 and the winter solstice of 2017 which will occur on December 21, 2017.
- Click the Create a New Scenario button.
- Enter the following in the New Scenario Wizard:
- When you finish, click OK.
- When the scenario loads, click Save (
 ).
).
| Option | Value |
|---|---|
| Name | Seasonal_Power |
| Description | How can I compare the power generation of my solar panels throughout the year? |
| Location | C:\Documents and Settings\<user>\My Documents\STK 11\ |
| Start | 21 Dec 2016 00:00:00.000 |
| End | + 366 days |
Model Aqua
You can set the scenario analysis period by typing Now, Today, NoonToday, Tomorrow, NoonTomorrow, or +/- a specified number of days or weeks in the appropriate fields. These settings reference the current date and time based on your computer's internal clock. If you save a scenario that includes these settings, the analysis period is updated every time the scenario is opened to correspond to the current date and time.
Aqua is a NASA Earth science satellite. Aqua is equipped with a radiometer, which is used for ground, ocean, and atmosphere observation. You need to model Aqua in this scenario. Perhaps you should check STK Data Federate to see if an Aqua model that includes the on-board equipment has already been configured and saved by someone else. If such a model already exists, it will save you some scenario building time.
- Bring the Insert STK Objects tool (
 ) to the front.
 - Select the following:
- Click the Insert... button.
- When the STK Data Federate tool appears, ensure that the Search tab is selected.
- Use the following criteria to locate the most recent Aqua model.
- Click the Advanced Criteria button.
- Click Search
- When the search results appear, select Aqua_27424.sa.
- Click Open.
By default, new facilities are inserted at the latitudinal and longitudinal coordinates of AGI headquarters near Philadelphia. If you are at AGI headquarters, select Insert Default as the method to position the facility at that location.
| Option | Value |
|---|---|
| Select an Object to be Inserted: |
 Satellite Satellite |
| Select a Method |
 From STK Data Federate From STK Data Federate |
| Option | Value |
|---|---|
| Search term | Aqua |
| Option | Value |
|---|---|
| Limit searching to my SDF Data | Off |
| Search by Filename only | Off |
| Date Created | After |
| Date Modified | After |
If you don't have internet access, you can use the Standard Object Database installed with STK to insert the Aqua satellite.
Change Your Perspective
Reposition your view so that you can get a better look at Aqua’s solar panels in 3D.
- Bring the 3D Graphics window to the front.
- Make Aqua_27424 () the focal point in the 3D Graphics window.
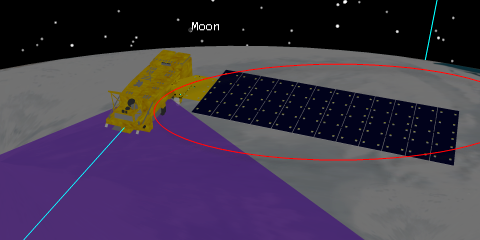
3D View: Aqua
Just like the real Aqua satellite, the Aqua model is equipped with 12 solar arrays. Each array can be defined as a group in the satellite model file. Having several individual arrays enables you to articulate the solar panels individually, rather than articulating one huge “solar panel wing.”
What is the Solar Panel Tool?
The Solar Panel tool enables you to model the exposure of solar panels mounted on spacecraft, aircraft, and ground vehicles over a given time interval. To compute the electrical power captured by the solar panels at a given point in time, the Solar Panel tool applies the following Basic Power Equation:
Power = Efficiency X Solar Intensity X Effective area X Solar Irradiance
- Efficiency is specified for the solar panel in the vehicle model file and ranges between zero (0) and one (1).
- Solar Intensity ranges from umbra zero (0) through penumbra (0 < i <1) to full sunlight one (1).
- Effective area is the cross-sectional area defined above.
The result of the analysis can be used to determine varying availability of electrical power for operations to be performed by the vehicle and on-board equipment.
- Right-click Aqua_27424 () in the Object Browser.
- Extend the Satellite menu.
- Select the Solar Panel... option.
- Bring the Solar Panel View window to the front.
- Solar Panel View: Aqua
- Now, bring the Solar Panel tool to the front again.
- Take a quick look at the Solar Panel Groups section.
- Are any of the solar panel groups listed on the Solar Panel tool for Aqua?
- Close the Solar Panel tool.
- Close the Solar Panel view.

Solar Panel View: Aqua
If you don’t see any solar panel groups, it is because they do not exist in the model file. You will have to use a model file that contains solar panel groups.
You can also determine if the model file has solar panel groups through the model file. If the solar panel groups are defined as a component, you will see them mentioned at the top of the model file.
Change Aqua’s Model
In order for solar panel groups to show up in the Solar Panel Tool section, they must be defined in the model. Right now, Aqua is set to use the default catalog model file (aqua.mdl). Let’s switch that out and use a customized model that has been provided. The customized model includes solar panels defined as components.
- Open Aqua_27424’s () properties (
 ).
). - Select the 3D Graphics - Model page.
- Click the ellipsis button (
 ) beside the Model File option.
 - Browse to the student files provided for this exercise (typically, <STK install folder>/Help/stktraining/samples).
- Select the aquaSPGroups.mdl file.
- Click Open.
- Under Model - Articulations, click the View button.
- Enable the Default solar panels to point at Sun.
- Click OK.
- Click Apply.
Ensure the Solar Panels are pointed at the Sun
Since we changed the model file, we have to ensure that the solar panels are correctly pointed at the Sun.
- Open Aqua_27424’s () properties ().
- Select the 3D Graphics - Model Pointing page.
- Ensure that the Assigned Target Object for Solar_Arrays-000000 is the Sun
- Click OK
Reopen the Solar Panel Tool
In order for the Solar Panel tool to take into account the new model file, you need to close it and reopen it. Had you left it open and changed the model, the new solar panel groups would not have recognized the new model components.
- Right-click Aqua_27424 () in the Object Browser.
- Extend the Satellite menu.
- Select the Solar Panel... option.
- Bring the Solar Panel View window to the front.
- Arrange the view so you can see the Solar Panel Tool and the Solar Panel View at the same time.
Visualization
The options in the Visualization area allow you to set an appropriate view for the solar panel exposure analysis, define a bound radius, and select among solar panel groups on a vehicle that has two or more such groups.
Bound Radius
The Bound Radius tailors the view to yield the optimal display for visualization and analysis. The field of view for solar panel illumination analysis is defined in terms of a rectangular plane rather than a linear boresight or direction of gaze.
You can limit the size of that plane by specifying the radius of a circle centered in the rectangle and touching its long sides. A circle having a radius equal to one-half the length of one of the short sides of the rectangle. This ensures that once the optimal dimension is set, the vehicle remains within view even when rotated.
You do not have any other objects in the scenario yet, so there is no chance that anything will obscure your view of Aqua if you enlarge it. Let’s increase the Bound Radius just a bit to ensure that Aqua’s solar panels are all in view.
- Bring the Solar Panel tool to the front.
- Enable the Bound Radius option in the Solar Panel Tool.
- Set the value to 13 m.
- Click Apply.
- Take a look at the Solar Panel View window.

Solar Panel View: Aqua
Solar Panel Groups
There are twelve solar panel groups. You need to ensure that all twelve solar panel groups will all be considered in the solar panel illumination analysis.
- Bring the Solar Panel tool to the front.
- Select all twelve solar panel groups from the Solar Panel Groups list.
- Click Apply.
Data
By default, the Solar Panel tool uses the scenario Analysis Period as the Data interval Start and Stop Times. You are interested in analyzing changes in power that occur when the sun is closest or furthest away during the year (the solstice and equinox times). Analyzing the entire year in one shot could take quite some time. Instead, you can limit the Solar Panel tool to more focused interval, which will limit the data calculation time and provide a more focused result. The first period of interest is the winter solstice of 2016, which occurred on December 21, 2016 at 10:44. Let’s begin by analyzing a three hour time period within which the first winter solstice falls.
- Set the following options in the Data section:
- Click Apply.
| Option | Value |
|---|---|
| Start Time | 21 Dec 2016 09:00:00.000 UTCG |
| Stop Time | 21 Dec 2016 13:00:00.000 UTCG |
| Time Step | 60 sec |
Get Moving
Now you can compute your first subset of data and determine if the winter solstice has had any effect on power generation.
- Arrange your workspace such that you can clearly see the Solar Panel tool window and it is not obstructing the view of either the Solar Panel View or the 3D Graphics window.
- Click the Compute button in the Data area on the Solar Panel tool.
- Watch the satellite animating in the Solar Panel View window.

Solar Panel View: Aqua illuminated
The Solar Panel View window displays the vehicle in black against a red background, with the solar panels shown in gray if illuminated. The greater the effective area of solar illumination of a panel, the brighter the shade of gray in which it is displayed. The effective area is the area of projection of the solar panel onto a plane perpendicular to the direction of the solar rays striking the panel.
- Can you see STK illuminate the solar panels?
Data Reporting
Now that you have computed the solar panel data, you can display various data in report or graph form. You are interested in the Effective Area report. The effective area report measures the solar panels illuminated by the sun and the effective area and the solar intensity at each time step.
- Set the following Data Reporting options:
- Click the Generate... button.
- When the Solar Panel Area report displays, scroll down to the All Solar Panel Group section.
- Does the effective area increase or decrease around the time of the solstice?
- At what time are the solar panels most fully illuminated?
- Leave the Effective Area report open.
| Option | Value |
|---|---|
| Type | Area |
| Report |
You can also use the Jump To drop-down and select All Solar Panel Groups.
The Solar Panel Area report for satellites provides data related to the area of the solar panels illuminated by the sun. The values reported as the Effective Area represent the solar panel area lit by the Sun and reduced by the cosine loss. This area can be readily incorporated in power computations. That means that if the solstice is having an effect on power generation, the Effective Area values should increase or decrease at and around the time of the solstice (10:44).
Run the Power Graph
The Effective Area changes during the solstice time and so does the power. Remember that power is directly related to the effective area as calculated by the Solar Panel tool:
Efficiency X SolarIntensity X EffectiveArea X Solar Irradiance= Power
- Bring the Solar Panel tool to the front.
- Set the following Data Reporting options:
- Click the Generate... button.
Note that this graph will change slightly every time the TLE for Aqua is updated. So your results may look different from the ones below. - Use the graph to answer the following question:
- How much power, on average, is generated during one satellite solar cycle?
- Close the Solar Panel tool.
- Close the Solar Panel view.
| Option | Value |
|---|---|
| Type | Power |
| Graph |
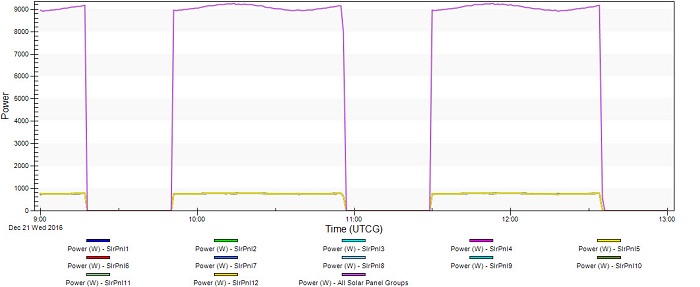
Graph: Power graph
Save Your Work
- Save () your work.
- Close the scenario (
 ).
). - Leave STK (
 ) open.
 Visit AGI.com