STK Professional, STK SatPro, Coverage and STK Analyzer.
The results of the tutorial may vary depending on the user settings and data enabled (online operations, terrain server, dynamic Earth data, etc.). It is acceptable to have different results.
Problem Statement
Your customer, the International Association of Yacht Manufacturers (IAYM), needs updated information on yacht usage. The IAYM wants to have an accurate count and location of all yachts greater than fifteen (15) meters in length operating on the open seas on any given day. Your manager has tasked you with providing a back-of-the-envelope design of a space-based system to satisfy these requirements.
Break It Down
You have some information that may be helpful. Here’s what you know:
- You need to survey all open seas on the surface of the Earth in a 24-hour period.
- You must be cost-conscious. You will consider a maximum of three (3) low-earth orbiting (LEO) satellites.
- You have some leeway with altitude of the satellites. You want to do some trade studies to determine how adjusting the altitude will impact the coverage.
- You will attach a conical sensor to each satellite that can track up to thirty (30) degrees off-boresight.
Solution
Build a scenario to determine what your coverage of the open seas will be over a 24-hour period, considering different variations of altitude on your satellites.
Create a New Scenario
- Click the Create a New Scenario button.
- Enter the following in the New Scenario Wizard:
- When you finish, click OK.
- When the scenario loads, click Save (
 ).
). - Verify the scenario name and location and click Save.
| Option | Value |
|---|---|
| Name | Yacht_Watch |
| Description | How will I survey yachts in seas all over the world? |
| Location | C:\Documents and Settings\<user>\My Documents\STK 11\ |
| Analysis Period | Leave the default analysis period. |
A folder with the same name as your scenario is created for you in the location specified above.
Walker Constellations
A Walker constellation consists of a group of satellites (t) that are in circular orbits and have the same period and inclination. The pattern of the constellation consists of evenly spaced satellites (s) in each of the orbital planes (p) specified so that t=sp. The ascending nodes of the orbital planes are also evenly spaced over a range of right ascensions (RAAN).
The Walker tool makes it easy to generate a Walker constellation using the Two Body, J2, J4, or SGP4 orbit propagators. The way in which spacing between the ascending nodes that define the orbital planes is calculated depends on the type of Walker constellation you choose--Delta or Modified Delta. In addition to specifying the number of satellites in each plane, you must also specify the location of the first satellite in each plane relative to the first satellite in adjacent planes. The way that you specify the position of the first satellite will depend on the type of Walker constellation you choose.
| Type | Description |
|---|---|
| Delta | For a Walker Delta constellation type, the relative along-track position of two satellites in adjacent planes is determined by a phase parameter (f) where f is an integer from 0 to p-1. The value of f represents the number of slots of angular measure (360 degrees/t) by which the more easterly satellite leads the more westerly satellite. |
| Modified Delta | The Modified Walker Delta option allows more flexibility in defining the spacing in RAAN and relative phase of the satellites in adjacent planes. The Number of Planes, Number of Sats per Plane, and Color by Plane options are the same as those for the Delta Type, but the modified delta creation also allows you to define the True Anomaly Phasing and RAAN increments. |
Create a Seed Satellite
The original satellite that is used to create the Walker constellation is referred to as the “Seed” satellite, while the satellites generated using the Walker tool are referred to as children. We’ll use the Orbit Wizard to create the “seed” satellite from which the other satellites will be derived.
- Return to the Insert STK Object tool (
 ).
). - Select the following:
- Click the Insert... button.
- When the Orbit Wizard appears, select the following:
- Accept all other default values.
- Click OK.
| Option | Value |
|---|---|
| Select an Object to be Inserted: |
 Satellite Satellite |
| Select a Method |
 Orbit Wizard Orbit Wizard |
| Option | Value |
|---|---|
| Type | Circular |
| Satellite Name | Yacht_Watcher |
| Inclination | 98 deg |
| Altitude | 400 km |
| RAAN | 0 deg |
Get a Better Look
Let’s animate the scenario and see how the low-earth repeating ground trace orbit that Yacht_Watcher is in covers the surface of the Earth.
- Bring the 3D Graphics window to the front.
- Play (
 ) the animation.
 - When you finish, reset (
 ) the animation.
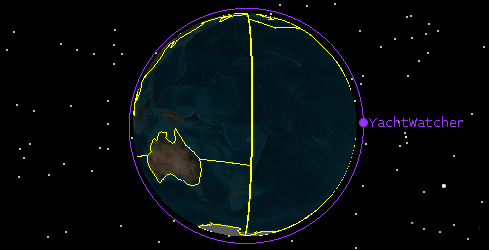
3D View: Yacht Watcher's orbit
Attach The Payload
We have our parent satellite, but we must add the radar with which we’ll be detecting the yachts. Attach a sensor to Yacht_Watcher and use it to model your radar's geometry.
- Select Yacht_Watcher () in the Object Browser.
- Use the Default Object tool (
 ) to attach a sensor (
 ) to Yacht_Watcher ().
 - Rename the sensor () Eyes.
Customize The Payload
Take a look back at the list you made in “Break it Down.” Each radar should slew 30 degrees off boresight.
- Open Eyes’ () properties (
 ).
). - Set the following sensor definition properties:
- Click OK.
| Option | Value |
|---|---|
| Type | Simple Conic |
| Cone Angle | 30 deg |
Create a Walker Constellation
Take a look at the list you made in “Break it Down.” According to what you know, there are cost constraints that limit you to three (3) satellites. Use the Walker tool to create a simple, single-plane constellation consisting of three satellites for your analysis.
- Right-click Yacht_Watcher () in the Object Browser.
- Extend the Satellite menu.
- Select the Walker... item.
- Enter the following values on the Walker tool dialog:
- Leave all other default values.
- Click Create Walker.
- Close the Walker Tool.
| Option | Value |
|---|---|
| Seed Satellite | Yacht_Watcher |
| Type | Delta |
| Number of Planes | 1 |
| Number of Sats per Plane | 3 |
| Inter Place Spacing | 0 |
| RAAN Spread | 360 deg |
Walker Satellite Relationships
When a Walker constellation is created, each child has the same base name as the seed satellite plus two numbers. The first number identifies the plane in which the satellite resides and the second identifies the satellite's position in the plane. For instance, here we define a Walker constellation with one plane and three satellites per plane, Yacht_Watcher12 would be the second satellite in the first plane.
If you keep the seed satellite in the scenario, two identically configured satellites (the seed satellite and the first satellite in the first plane) will be considered in your analysis. To prevent duplicate analysis, let’s remove the seed satellite, now.
- Save () the scenario (
 ).
). - Remove (
 ) Yacht_Watcher () from the scenario.
When you save the scenario, all objects in the scenario are also saved. It is important that you save the scenario before you remove Yacht Watcher as we need to reload it later for further analysis.
Create a Constellation
Each resulting Walker satellite has an instrument, represented by a sensor object in STK, associated with it. You will be using these radars to examine your coverage of the open seas. We need to group the sensors together in a constellation so that they can be considered as a group for analysis purposes.
- Insert a constellation (
 ) using the Object Browser and name it All_Eyes.
 - Open All_Eyes’s properties (). The Basic - Definition page should already be selected.
- Move (
 ) all of the sensors in the scenario to the Assigned Objects list.
 - Click OK.
World Water Coverage
You want to assess coverage over, or your ability to detect yachts in, the open seas. To do this you will assess coverage of the open seas that is based on the boundaries of a shape file (.shp) that can be pulled into your coverage grid. You will need to specify the region being examined, how each grid point should be treated, and what assets will be used to examine the region.
- Insert a coverage definition object (
 ) using the Default Object tool.
 - Rename the coverage definition WorldWater_Cov.
- Open WorldWater_Cov's () properties (). The Basic - Grid page should already be selected.
- Change the Grid Area to Custom Regions.
- Click the Select Regions… button.
- Click Load Region File.
- Ensure the File of Type is set to a shape file (.shp).
- Browse to the location of the water shapefiles installed with STK (typically, <STK install folder>\Data\Shapefiles\Water\).
- Open WorldWater_Cov.shp.
- Click OK to return to the Grid page.
- Change the Point Granularity to Lat/Lon 5 deg.
- Click Apply.
If we had area targets in our scenario we could use those as the outline of our coverage grid. Since we don’t, we can use a shape file (.shp) as the outline for our grid.
Your grid boundary has now been directly brought into your Coverage Definition object.
Assign Assets
- Open the Basic - Assets page.
- Select All_Eyes () from the Asset list.
- Click Assign.
- Click Apply.
Manage Your Resources
Since we have a lot going on here, let’s not tie STK up recomputing access before we need it.
- Open the Basic - Advanced page.
- Disable the Automatically Recompute Accesses option.
- Click OK.
Compute Coverages
Let’s move forward and see if we’ll be able to locate yachts in the open seas.
- Right-click WorldWater_Cov () in the Object Browser.
- Extend the Coverage Definition menu.
- Select Compute Accesses.
For larger scale calculations, consider computing the accesses for coverage in parallel using multiprocessing. This can be done using multiple cores on a local machine, or taking advantage of cluster configurations, depending upon your machine configuration. For more information on machine configuration, installation of the Parallel Extension, licensing, and more, please see the STK Help system.
It may take a moment for STK to compute coverage. The progress indicator at the bottom of the STK Workspace will indicate when computations are complete.
Measure The Quality of Coverage
While access has already been computed, we’d like to measure whether or not each point is accessible by any of the assigned assets. Add a Figure of Merit so that we can determine the quality of coverage.
- Attach a Figure of Merit (
 ) to WorldWater_Cov () using the Default Object tool.
 - Rename it Hows_My_Cov.
The default figure of merit is Simple Coverage, so we don’t need to change the properties for Hows_My_Cov ().
As soon as you introduce the new object, figure of merit graphics will display in the 2D and 3D Graphics windows. Based on the graphics display, you can see that there are visible gaps in your coverage, but what percentage of the worlds oceans are covered?

3D View: World water coverage quality
Percent Satisfied
- Open the Report & Graph Manager (
 ).
). - Select the following:
- Click Generate.
- When you finish, close the Percent Satisfied report.
- Close the Report & Graph Manager ().
| Option | Value |
|---|---|
| Object Type | Figure of Merit |
| Object (Below Object Type) | Hows_My_Cov |
| Show Reports | On |
| Show Graphs | Off |
| Style | Percent Satisfied |
| Generate as | Report/Graph |
The Percent Satisfied report simply tells you what percent and what area of your coverage region (WorldWater_Cov) had access at some point during the defined time period to at least one sensor in All_Eyes ().
You can see that the Walker constellation that we created has left us short of our goal of covering the entire ocean in a day. Wouldn’t it be nice if you could determine how to get 100% coverage? For instance, would you have better coverage if you boosted the altitude of your satellites? Maybe, but what altitude would be the best? Should you adjust your satellites and redo your analysis at a variety of altitudes? It would be tedious to repeat the entire scenario time and time again for each altitude that you want to test. Fortunately, you don’t have to! STK/Analyzer is a tool that can automate such a study for you.
STK Analyzer
The STK Analyzer module is an integrated software solution that automates STK trade studies and parametric analysis by blending the engineering analysis capabilities of Phoenix Integration, Inc’s Model Center with the STK software suite from AGI. STK Analyzer enables STK users to easily perform trade and optimization studies, as well as post-processing functions. This module provides engineers with the tools to understand the design space of their system through an easy-to-use GUI style interface, eliminating the need of scripts or programming. STK Analyzer provides a set of analysis tools that:
- Enable you to understand the design space of your systems.
- Enable you to perform analysis in STK easily without involving programming or scripting.
- Introduce trade study and post-processing capabilities.
- Can be used with all STK scenarios, including those with STK Astrogator satellites, to perform the following types of analysis.
Analysis Tool
| Tool | Description |
|---|---|
| Parametric Study | Vary one item over a range and study the effects on various figures of merit defining performance. |
| Carpet Plot | Vary two items over ranges and study the resultant behavior of another parameter. |
| Design Of Experiments | Vary multiple parameters, creating a table of runs, using various design type algorithms, to study the effects on various parameters. |
| Probabilistic Analysis | Run studies in Monte Carlo fashion, wherein input parameters are set up to follow certain distribution methods and study the resultant behavior. Output data can be analyzed and presented in histogram fashion. |
| Optimizer | Systematically modify variables in a scenario until some objective is achieved. |
Clean Up
As we perform our parametric analysis, STK Analyzer will create new Walker constellation and associated sensors for us. Take a moment to remove the existing Walker satellites.
- Select all of the Yacht_Watcher satellites () in the Object Browser.
- Right-click, and select Delete ().
Coverage graphics didn’t change because our option to Automatically Recompute Access for WorldWater_Cov is turned off. If we recomputed the accesses, our graphics would disappear because there is no coverage anymore.
Reload the Yacht Watcher Satellite
The first thing you need to do is reload the original Yacht_Watcher satellite that you created because you will need it to create the new Walker constellation.
- Bring the Insert STK Object Tool () to the front.
- Make the following selections:
- Click the Insert... button.
- Locate the directory where you saved the scenario (C:\My Documents\STK 11\Yacht_Watch\).
- Select Yacht_Watcher.sa.
- Click Open.
- Before you go any further, save () your work.
| Option | Value |
|---|---|
| Select an Object to be Inserted: |
Satellite |
| Select a Method |
 From Satellite File (.sa) From Satellite File (.sa) |
Rebuild the Constellation
Since you removed the satellites, you will need to rebuild the constellation. Let’s do that now.
- Open All_Eyes’ () properties.
- Select the Basic - Definition page.
- Move the sensor to the Assigned Objects list.
- Click OK.
Assign Your Assets
Again, because you removed the satellites from the scenario, you need to ensure your assets are correct in your coverage analysis.
- Open WorldWater_Cov () properties.
- Select the Basic - Assets page.
- Select the All_Eyes constellation.
- Click Assign.
- Click OK.
Launch Analyzer
Now, you can launch STK Analyzer.
- Select Analysis in the menu bar.
- Extend the Analyzer menu.
- Select Analyzer...
Assign the Analyzer Variables
You first need to set up the Analyzer analysis so that you can use the appropriate variables for your analysis. You will need access to the satellite altitude and Walker parameters for your inputs, and your Coverage Definition object for your outputs. Let’s set those up now.
- Select Yacht_Watcher in the STK Variables.
- Expand Propagator (J4 Perturbation) in the STK Property Variables.
- Drag the Semi Major Axis variable and drop it in the Analyzer variable box on the right side of the Analyzer window.
- Select Walker in the STK Property Variables General tab.
- Drag the Walker variables and drop it in the Analyzer variables box on the right side of the Analyzer window.
- Expand WorldWaterCov in the STK Variables list.
- Select Hows_My_Cov.
- Expand the Static Satisfaction in the Data Provider variables tab.
- Drag the Percent Satisfied variable and drop it in the Analyzer variables box on the right side of the Analyzer window.
You will notice that Analyzer automatically assigns Percent Satisfied as an output variable.
The Parametric Study Tool
Now that you have entered in your variables and outputs, you need to set up the study. You only need to vary one variable, so you can use the Parametric Study to accomplish this.
- Click the Parametric Study... (
 ) button.
You may have to wait a few moments for Analyzer to “ingest” all of the STK objects in your scenario. When the Parametric Study tool appears, notice the left side of the interface has a components list, which outlines the objects that you defined for your Analyzer study. Each item in the components list can be expanded to view its details and properties. The right side of the Analyzer window is used to modify a selected component’s parameters and specify output.
Define Your Design Variables
You need to tell Analyzer that you want to:
- Adjust the altitude of our “seed” satellite, Yacht_Watcher
- Use the resulting Yacht_Watcher to generate a Walker constellation, and
- Place the resulting Walker sensors into a constellation that can be used to calculate coverage.
Set the Propagator
- Expand Yacht_Watcher’s () properties in the Components list.
- Expand Propagator.
- Drag the Semi-major Axis variable and drop it in the design variable (
 ) box on the right side of the Analyzer window.
 - Set the following values below the design variables box:
Our initial Yacht_Watcher altitude was 400 km, and we know the resulting coverage for that altitude. Let’s try adjusting the altitude up to 600 km in increments of 50 km to see what coverage is provided at various altitudes.
| Option | Value |
|---|---|
| Starting Value | 6828 (do not enter units) |
| Ending Value | 6978 (do not enter units) |
| Number of Samples | 4 |
Asking for four (4) samples will automatically set the step size to 50 (450, 500, 550 and 600 km).
The original semi-major axis displayed in Analyzer is 6778 km (the altitude of the satellite, 400 km, plus the radius of the Earth, 6378 km=6778 km). You want your first altitude sampling to be 450 km--50 km above the original semi-major axis. To set the first sampling you need to add 50 km to the original value (400 km + 50 km + 6378 km=6828 km). To determine the ending value number of samples (4) X sample size (50) = 600 km + the radius of the Earth (6378 km)=6978 km.
Set Walker as a Variable
- Expand Yacht_Watcher’s () properties in the Components list.
- Expand Walker.
- Set the following variables:
| Option | Value |
|---|---|
| Enable | true |
| WalkerType | Delta |
| Constellation | All_Eyes (you must type this exactly as it appears in your scenario. |
| Constellation Type | Sensor |
| numPlanes | 1 |
| numSatsPerPlane | 3 |
| RAAN Spread | 360 |
| walkerParam | 0 |
walkerParam would be the equivalent of interplane spacing if you were using the Walker tool.
Define Your Responses
You’ve told Analyzer what to put in, now let’s tell it what data you want it to return. You decided earlier that you want to know the percent satisfied based on the simple coverage figure of merit.
The information you are looking for in Analyzer is the same data found in the Percent_Satisfied report from earlier. However, you have not defined the data provider as the response yet. Let’s do that now.
- Expand the WorldWaterCov variable.
- Expand the Hows_My_Cov variable.
- Expand the Static_Satisfaction directory.
- Drag Percent_Satisfied to the Responses section on the right side of the Analyzer window.
- Click Run…
It will take several minutes to analyze the different scenarios. Take a look at the Object Browser and the 2D and 3D Graphics windows. You will see the various Walker constellations being created and the coverage calculations progressing.
Review Your Results
When the analysis is completed, you can view the results in the Data Explorer that appeared when run was initiated. The Data Explorer is a tool used by Trade Study tools to display data while they are being collected from STK. While data is being collected, the Data Explorer displays a progress meter, a halt button, and the data.
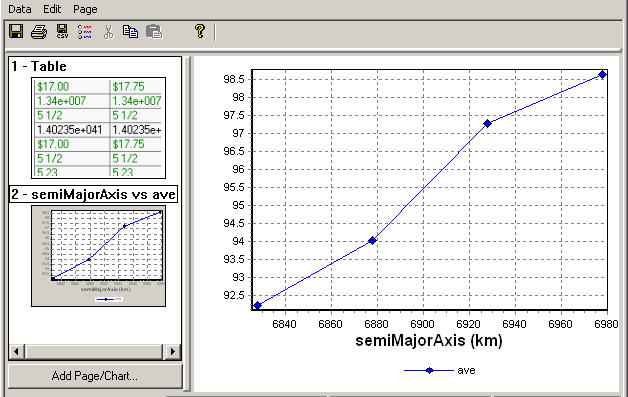
The Data Explorer will display a graph that plots the resultant data. Take a look at the graph in the Data Explorer. Because we selected ReportValue 1 as our output, our graph shows the Percent Satisfied.
Table Data
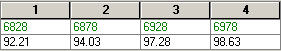
If you want more specific data about the points on the graph, click 1 - Table on the left side of the Data Explorer.The Table view gives a summary of the parameters used for each run, like so:

Data Explorer: Variables summary in table data view
Additionally, it lists all the input and output values in our Just The Data report, like so:
Data Explorer: Results summary in table data view
The numbers listed above are meant to show you want the results summary looks like and are not intended as specific Analyzer results. Your results will vary from those shown.
- Use the data provided in the Data Explorer to answer the following questions:
- Do you achieve 100% coverage of the oceans with any of the constellations created?
- If not, how close do you come to 100% coverage?
- Between which two altitudes did you gain the greatest % coverage?
- Between which two was your gain the least?
- How would you change your Analyzer set up if you wanted to see Area Satisfied instead of Percent Satisfied?
Now you are armed with some preliminary design information. You can meet with your customer and discuss the pros and cons of higher orbit insertion costs versus coverage. You could also use Analyzer to consider numerous other design options such as different types of Walker orbits, perhaps three planes of one satellite each might yield more favorable results, etc.
Save Your Work
In the event that your customer wants you to consider other design options for this scenario, you can save this Analyzer set up for future use.
- Close the Data Explorer.
- In the --favorites list-- drop-down menu at the top of the Analyzer window, select Add Current Configuration as a Favorite.
- Name this configuration Yacht Watch: Just The Data.
- Click OK.
- Close the Parametric Study tool.
- Save () your work.
- Close the scenario ().
- Close Analyzer.
 Visit AGI.com