The following tutorial uses an example analysis to familiarize you with the capabilities of the EOIR module. You will need an EOIR license to complete this tutorial.
STK Professional and Electro-Optical Infrared Sensor Performance (EOIR).
Watch the following video, then follow the steps below incorporating the systems and missions you work on (sample inputs provided).Define the Scenario's Assets
You will be using the MSSC 1.6m telescope at the AMOS observatory in Maui, Hawaii, to track a polar satellite in LEO. To create a scenario and define its assets:
- Create a new scenario with the following Start and Stop times:
- Name: STK_EOIR
- Start Time: 1 Jan 2018 16:00:00 UTCG
- Stop Time: + 10 min
- Click OK.
Create a Star Database
To include more stars in the analysis, create a star database containing stars up to a higher visual magnitude than the default star database
-
Open the scenario's (
 ) properties (
 ).
).
- Select the BasicàDatabase page.
- Select Star as the Database Type.
- Click Create... to create a new star collection based on Hipparcos 2 Mag 6.
- Under Visual Magnitude, set the Maximum to 8 and rename the collection as Hipparcos 2 Mag 8.
- Click the Save Collection button. Click OK on the the saved collection prompt.
- Click Close to return to the Database Properties page.
- Ensure the Star Collection field contains Hipparcos 2 Mag 8.
- Click OK to apply your changes and close the properties page.
Insert a Facility
Use the Insert STK Objects tool to add the MSSC_1_6m facility from the Standard Object Database.
- Bring the Insert STK Objects tool to the front.
- Select Facility and From Standard Object Database as the Method. Click Insert...
- Enter MSSC in the Name field and click Search.
- Select 'MSSC 1.6m' and click Insert.
- Click Close to return to the Insert STK Objects tool
Verify EOIR is Installed and Active
Ensure that the EOIR plugin is installed and active.
- Extend the Edit menu, extend the Preferences menu, and select UI Plugins. The EOIR Sensor Plugin is installed if it appears in the Plugin list and it is available for use if Active is enabled.
- Click OK to exit the Preferences page.
- If you do not see the EOIR toolbar, extend the View menu and select Toolbars to add the EOIR Sensor Plug-In Toolbar.
Add a Sensor to the MSSC_1_6m Facility
Let's add a sensor to the facility you just added to the scenario.
- Attach a sensor to the MSSC_1_6m facility.
- Set the sensor type to EOIR on the sensor's BasicàDefinition page.
Set the EOIR Properties for the Sensor
You can set up this sensor to model the large AEOS telescope at AMOS.
- Open the sensor's properties. You will set up this sensor to model the large AEOS telescope at AMOS. The first tab contains the spatial information of the sensor. This is where you define the total field-of-view angles and the number of pixels on the sensor detector.
- Set the following parameters:
- Select the Spectral tab. This tab is where you define the spectral range of your sensor. The sensor model samples your spectral band using the number of intervals you define. The more intervals you have, the higher the accuracy of the analysis. However, more intervals mean longer computation time.
-
Set the following Spectral Parameters:
Option Value Spectral Band Edge Wavelengths - Low 0.4 um Spectral Band Edge Wavelength- High 0.7 um NOTE: The telescope observes the long infrared waveband, if you would like to do your analysis with those parameters, then set the Spectral Band Edge Wavelengths Low to 0.7 um and High to 1.0 um.
- Select the Optical tab.
- For STK v11.2, Change the Input to F-Number and Entrance Pupil Diameter.
- For STK v11.1 or earlier use the following. (Note: the images and graphs will look slightly different)
- Select the Radiometric tab. This is where you define the noise floor and the saturation ceiling. You can define a set of points that relate Integration (Exposure) Time to NEI/SEI. STK linearly interpolates between the points to get correct NEI/SEI for the integration time you set at the bottom of the window.
-
Set the following Sensitivity parameters:
Option Value Sensitivity - Integration Time 100 Sensitivity - Equivalent Value 1e-16 - Set the Processing Level to Sensor Output. The processing levels allow you to visualize the geometric information in the sensor scene or the sensor output image. The Radiometric Input simulates the light entering the sensor lens before hitting the sensor detector when generating the EOIR sensor scene.
- Set the Line of Sight Jitter to one (1.0) mrad to introduce a Gaussian vibration along the sensor boresight.
- Click OK to apply and save your changes.
-
Open the Target Configuration (
 ) window. This window defines the objects used in the EO/IR analysis.
- Verify that Facility/MSSC_1_6m is in the Selected Targets list.
For a more detailed explanation of the EOIR property windows click the Help button on the bottom of the properties page.
| Option | Value |
|---|---|
| Field of View Vertical Half Angle | 7.5 deg |
| Field of View Horizontal Half Angle | 7.5 deg |
The Number of Pixels and Instantaneous Field of View are based on the Spatial and Optical properties and are updated when Apply is clicked. These are read-only fields.
| Option | Value |
|---|---|
| F/# | 200 |
| Entrance Pupil Diameter | 367.00 cm |
| Image Quality | Negligible Aberrations |
| Option | Value |
|---|---|
| F/# | 9.0 |
| Effective Focal Length | 3267.00 cm |
| Image Quality | Negligible Aberrations |
The Image Quality property models wave front error through the optics. The Negligible Aberrations setting introduces 7% wave front error.
Generate EOIR Sensor Scenes
Now you are ready to generate sensor scenes. These scenes accurately portray sensor images for the processing level selected.
-
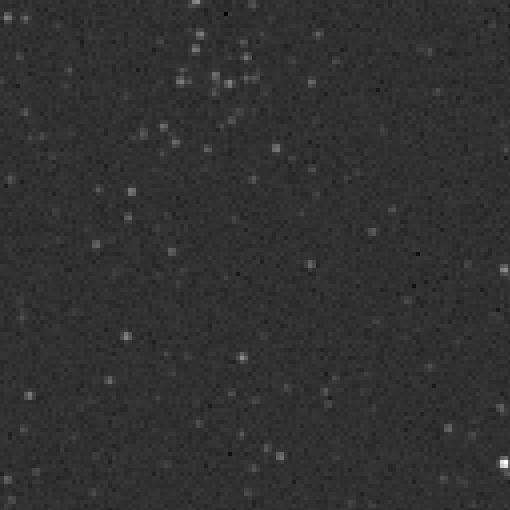
Select the sensor in the Object Browser and click
 to generate an image that represents the radiometric input to the sensor. You will see some white dots and gray dots against a black background.
- Right-click on the sensor scene and select Details.... Here you can set the color map, determine the resolution of the Earth map using the scene detail box, adjust the brightness and contrast, change the file output settings, and return back information on the pixel clicked inside of the sensor scene. Set the Color Map to BGRY and click Apply.
- For the Sensor Output processing level, the raw sensor data and image can be saved out at every animation step. For all other processing levels, the image can be saved out at every animation step.
- To zoom in, click the scene window, and with the mouse wheel depressed, move the mouse to zoom in and zoom out.
- Click around the scene to view information on each pixel. Click on one of the stars to get more details on this object.
- Close the EOIR Scene Visual Details properties page and the EOIR Sensor Scene window.
Create a Satellite that Flies Over the Facility
Using the Orbit Wizard, create a satellite that flies over the MSSC_1_6m.
- Bring the Insert Objects tool to the front.
- Select Satellite and Orbit Wizard as the Method.
- Set the following values in the Orbit Wizard:
- Click OK to insert the new satellite.
| Option | Value |
|---|---|
| Type | Circular (default) |
| Inclination | 98 deg |
| Altitude | 500 km (default) |
| RAAN | 189 |
Zoom To the Satellite
- Zoom To the satellite in the 3D Graphics window. Pan and zoom around so that you can view both the satellite and the facility.
- Set the Time Step to one (1) second and animate the scenario.
When the target satellite passes over the AMOS facility, AMOS is in darkness while the satellite is illuminated. This scenario gives good lighting conditions for imaging.
Although this tutorial is a ground-to-space example, it is possible to host an EOIR sensor on air and space vehicles. The work flow of setting up an EOIR sensor model is similar for all supported STK objects.
Examine the Satellite's Basic EOIR Shape
Let's examine the material and shape properties of your satellite.
- Open the Satellite's Basic-->EOIR Shape properties page.
- Examine the following options:
Open the Target Configuration (
) box and add Satellite/Satellite1 to the Selected Targets list.Click OK to close the EOIR Configuration window.
| Option | Value |
|---|---|
| Shape | Sphere (default) |
| Radius | 1 m |
| Body Temperature | Static (default) |
| Temperature | 273 K (default) |
| Material | Gray Body (default) |
This temperature is steady and uniform over the body and corresponds to its external temperature in sunlight.
Available objects include central bodies, satellites, facilities, missiles, and aircraft. Both targets and sensor parent objects must be included as Selected Targets.
Re-generate EOIR Sensor Scene
Run an access report between the sensor and the satellite.
- Right-click the sensor object and select Access... from the Sensor menu.
- Select the Satellite1 under the Associated Objects list.
- Select the Advanced... button and disable Use Light Time Delay. Light time delay is not used in EOIR analysis.
- Click Access in the Reports field.
- 1 Jan 2018 16:05:19.723
- 1 Jan 2018 16:05:37.186
- Right-click the start time in the Access report and extend the Start Time menu.
- Select the Set Animation Time option. This sets the animation time to the access time, which will be reflected in the animation field.
- Keep the access report open.
-
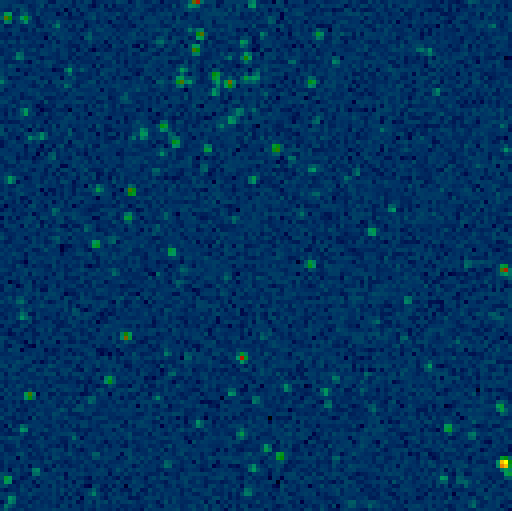
Select the sensor in the Object Browser and click to generate an image that represents the sensor output.
You will see colorful dots against a dark background.
- Set the Time Step to 0.5 and animate the scenario until you see the satellite come into the scene. (The dot that represents the satellite moves across the scene while the stars stay relatively still.)
- Right-click on the sensor scene and select Details....
- Click around the scene to view information on each pixel. Click on one of the stars and the target satellite to get more details on those objects.
- Close the EOIR Scene Visual Details properties page and the EOIR Sensor Scene window.
The Access report shows one access interval at or near the following times:
Create Custom Graphs for EO/IR Sensors
The EOIR module does more than simulate scenes created by an EO/IR sensor. It can also calculate metrics a sensor would receive from a target's signal. The following will familiarize you with some of the available EOIR data providers.
- Open the Report & Graph Manager for the sensor on the facility.
-
Click the Create a New Graph (
 ) style to create a custom graph for the sensor.
- Name the new graph EOIR Sensor-to-TargetMetrics.
- Open up the graph's Content properties.
- In the EOIR Sensor to Target Metrics data provider, select the following data elements:
- Y Axis: Effective target irradiance
- Y2 Axis: Signal to noise ratio
- Set the following titles:
- Select EOIR Sensor to Target Metrics-Effective target irradiance under Y Axis and click Units... below the Y2 Axis box.
- Clear Use Defaults option and select Power.
- Select Watts (W) as the new unit value.
- Click OK to finalize your custom graph and return to the Report & Graph Manager.
| Option | Name |
|---|---|
| Time Axis Title | Time |
| Y Axis Title | Effective Target Irradiance |
| Y2 Axis Title | Signal to Noise Ratio (SNR) |
Set the Time Properties
- Set the Time Properties under Time Properties.
- Select Specify Times as the type.
-
Click (
 ) to the right of the Start and Stop times and select Interval Component....
-
In the Select Time Interval window, select the Access object (
 ).
).
- Under Installed Components, expand Access Intervals.
- Select First (since there is only one access interval) and click OK to return to the Report & Graph Manager.
- Enable Use step size/time bound and set the Step Size to 4 seconds.
Generate the Custom Graph
- Generate the graph.
- Select the Satellite as the target.
EOIR calculations are computationally expensive. It is recommended that you confine your report and graph times to access intervals and choose your time steps wisely.
You should see a graph similar to the one below:
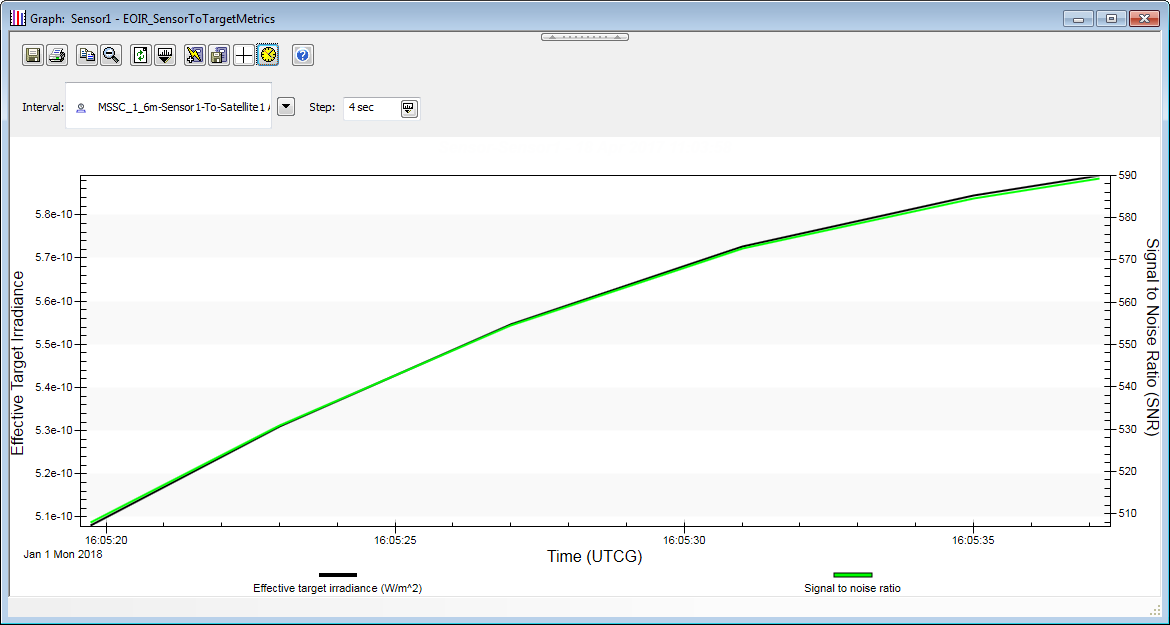
This graph shows the signal large relative to the noise by up to a factor of 30 to 1 which is why you are able to see the target clearly in the scene. Keep the graph open.
Define more EOIR Properties
-
Open the Target Configuration () box.
- Click Atmosphere Definition... to display the EOIR Atmosphere Model properties.
Take a minute to view the different atmosphere models available with EOIR, Simple Atmosphere and MODTRAN Atmosphere
- The Simple Atmosphere calculates the atmospheric properties at the wavelengths corresponding to the Spectral Band Edges, and at a spectral resolution specified by the Number of Intervals set on the Sensor's Spectral Properties page.
- The MODTRAN-based atmosphere model is one of the highest fidelity, community standard, atmospheric models available in EOIR. As such, it takes longer to compute.
-
Set the following Simple Atmosphere parameters.
Option Value Aerosol Models Maritime Visibility 40 km Humidity 70 % - Click OK to close the EOIR Atmosphere Model
- Click OK to close the EOIR Configuration window
- Select the sensor in the Object Browser and click to generate an image that represents the sensor output. Take a moment to view the new synthetic scene.
- Open the Target Configuration () box.
- Re-open the EOIR Atmosphere properties
- Set the Atmosphere Mode back to Atmosphere Off for the remainder of this tutorial and return to the EOIR Configuration window.
- Click OK to close the EOIR Configuration window
Re-generate EOIR Sensor Scene
-
Select the sensor in the Object Browser and click to generate an image that represents the sensor output.
- Right-click on the sensor scene and select Details....
- Set the Time Step to 0.5 and animate the scenario. You will see only ONE bright dot that represents the satellite moving against a dark background. Once the satellite moves out of the scene, the stars will return to the image.
- Close the EOIR Scene Visual Details properties page and the EOIR Sensor Scene window.
The data in each sensor click can be saved to a file by selecting Pixel Spectral Data on the EOIR Scene Visual Details page. For the Sensor Output processing level, the raw sensor data and image can be saved out at every animation step. These images can be compounded to create a movie or run through external image processing software for further analysis.
Refresh the Custom Graph
- Refresh the graph. You will see a graph similar to the one below:
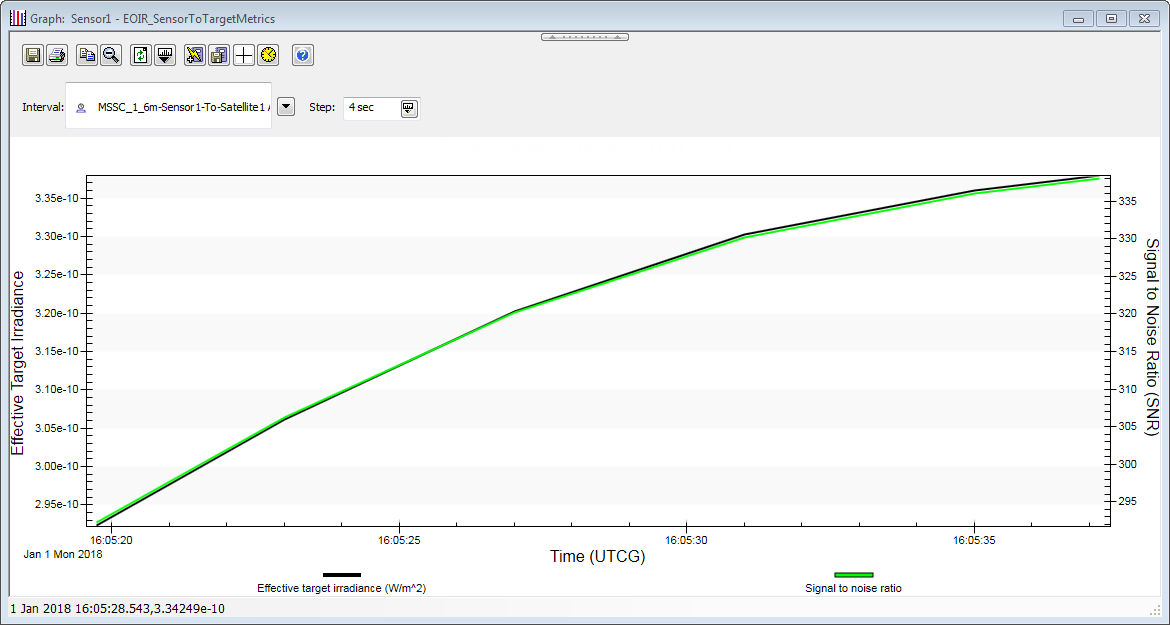
This graph shows the signal large relative to the noise by up to a factor of 15 to 1. The degradation is due to the atmosphere effects. Keep the graph open.
Redefine the EOIR Properties
Let's define the material and shape properties of your satellite and the properties of your EO/IR sensor.
Define the Satellite's Basic EOIR Shape
- Open the Satellite's Basic-->EOIR Shape properties page.
- Set the following options:
| Option | Value |
|---|---|
| Shape | LEOComm |
| Body Temperature | Static (default) |
| Temperature | 400 K |
| Material | Aluminum MLI |
This temperature is steady and uniform over the body and corresponds to its external temperature in sunlight.
Re-generate EOIR Sensor Scene
-
Select the sensor in the Object Browser and click to generate an image that represents the sensor output.
- Right-click on the sensor scene and select Details....
- In general, a satellite will be dimmer than the brightest stars in the FOV. To make that satellite easier to see, slide the Brightness slider all of the way to the right. When you click apply, more objects in the scene will be visible, but which one is the satellite?
- Set the Time Step to 0.5 and animate the scenario. The dot that represents the satellite moves across the scene while the stars stay relatively still. You may need to zoom in to see the satellite. To zoom in, click the scene window, and with the mouse wheel depressed, move the mouse to zoom in and zoom out.
- Click around the scene to view information on each pixel. Click on one of the stars and the target satellite to get more details on those objects.
- Close the EOIR Scene Visual Details properties page and the EOIR Sensor Scene window.
Refresh the Custom Graph
- Set the Step value to 0.5 seconds.
- Refresh the graph. You will see a graph similar to the one below:
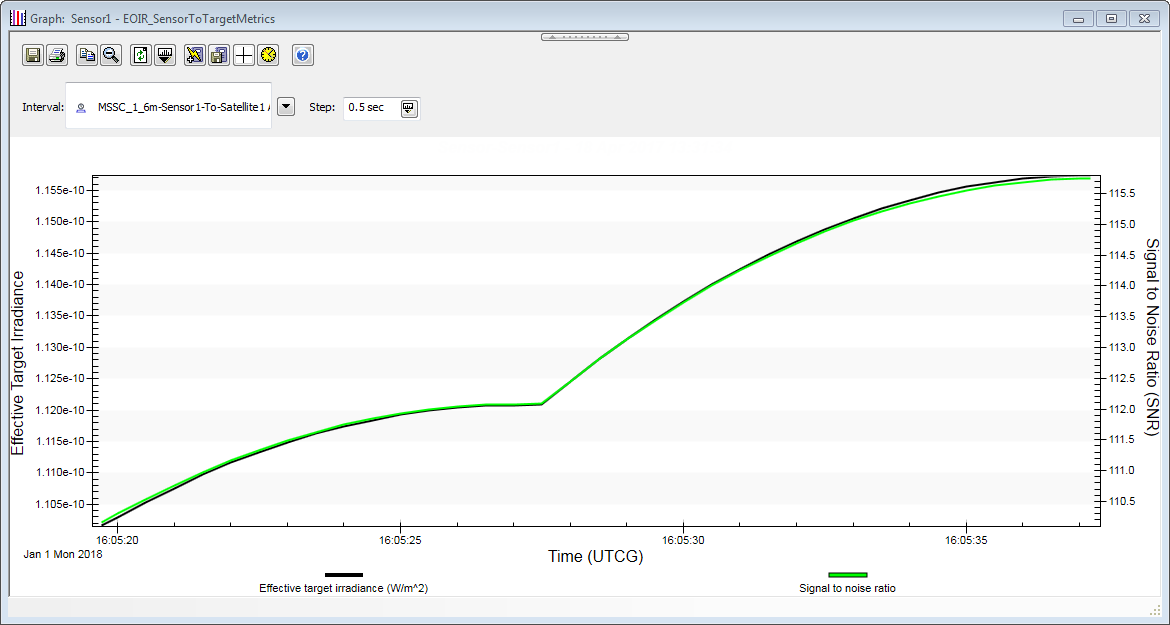
The curve is smooth, showing a single minimum in effective target irradiance and SNR that coincides with the satellite passing near the facility's zenith. This signal is consistent with a target that does not greatly change orientation with respect to the telescope.
Re-generate EOIR Sensor Scene
-
Select the sensor in the Object Browser and click () to generate an image that represents the sensor output.
- Compare with using the previous Star Collection.
- Close the EOIR Sensor Scene window.
Analyze the Light Signature
Now you will analyze the light signature of a tumbling satellite to compare to the nadir pointing satellite.
- Select the satellite's Basic-->Attitude page.
- Set the following options:
- Zoom To the satellite.
- Set the time step to 0.1 seconds.
- Animate the scenario to view the satellite's spinning orbit in the 3D Graphics window.
| Option | Value |
|---|---|
| Type | PrecessingSpin |
| Body Spin Axis: |
Type: Cartesian (X,Y,Z) = 0,1,0 |
| Precession Rate | 30 revs/min |
| Spin Rate | 30 revs/min |
Refresh the Graph
- If need be, change the scaling of the Y axis:
- Double-click the Effective Target Irradiance title and select the Axis tab.
- Select Min/Max in the Y-Axis (default).
- Enter the following values:
- Refresh the custom Irradiance and SNR graph. Set the time step to 0.1 sec. You will see a graph similar to the one below, your graph does not need to match the exactly:
| Option | Value |
|---|---|
| Min | 0 |
| Max | 3e-010 |
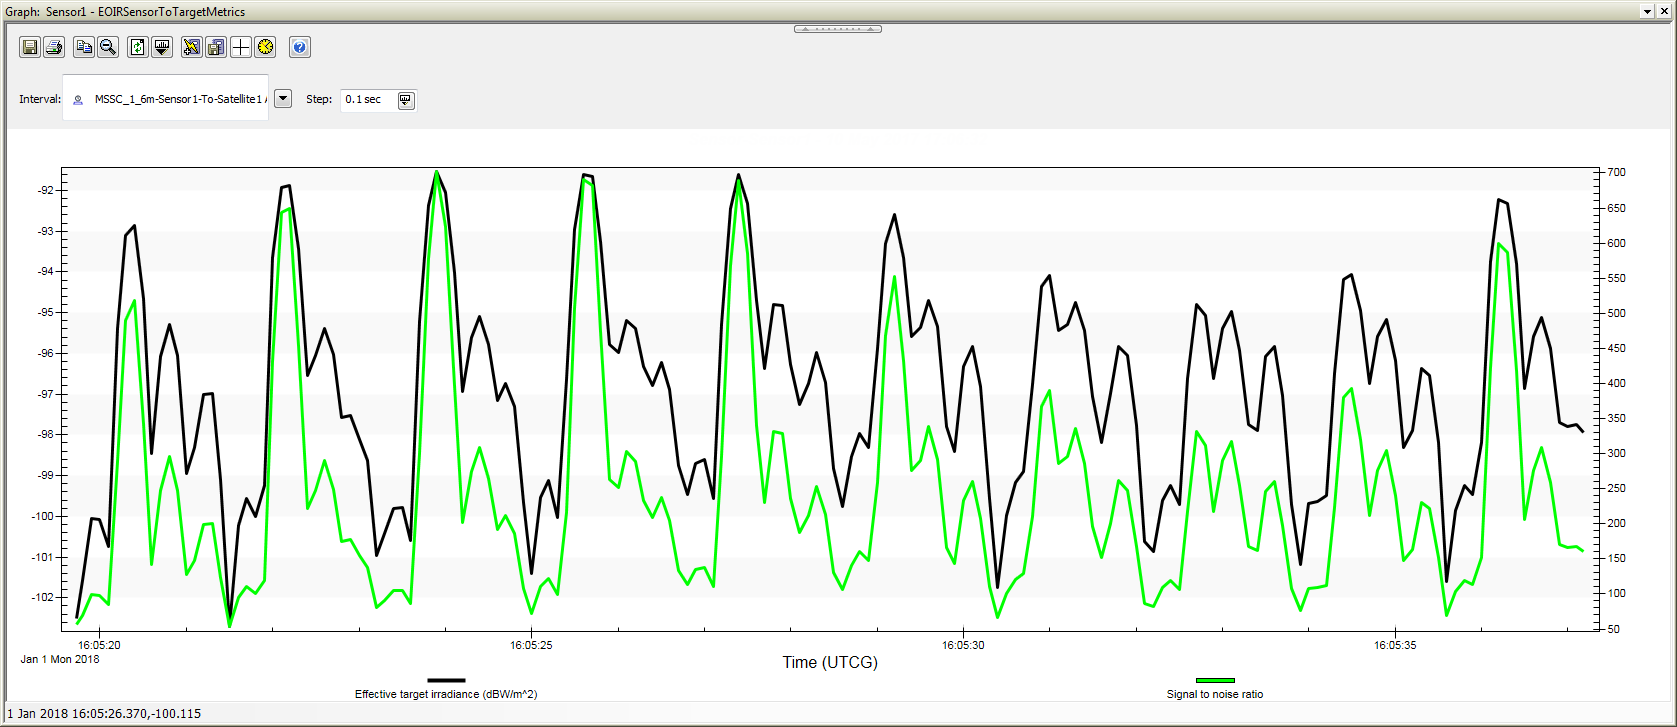
The plot is jagged thus confirming that the spacecraft is tumbling. As the spacecraft rotates, various panels reflect varying amounts of light and create an unsmooth plot.
The graph may take approximately 20 minutes to generate.
To become more familiar with all the capabilities of EOIR, continue to experiment with changing EOIR properties and creating scene settings.
For example, use the ModTran Atmosphere Model to define the atmosphere. To access the model, go to the Target Configuration () box and click Atmosphere Definition...
 Visit AGI.com