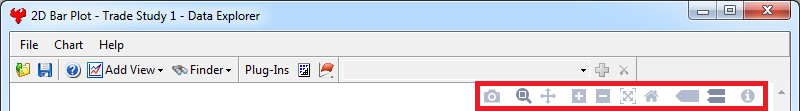
View Controls
The view controls are displayed in the upper-right corner of plot windows. Different controls will display depending on the plot selected.
| Control Name | Icon | Use |
|---|---|---|
| Download plot as a png |
|
Save the plot area as a .png. A Windows Save As dialog will open. |
| Zoom |
|
Turns the cursor into a crosshairs; click and drag to highlight the section to zoom in to. Double-click anywhere in the plot area to zoom back to 100%. |
| Pan |
|
Turns the cursor into a crosshairs with arrows (like the icon); click, hold, and drag to move the plot area around. Double-click anywhere in the plot area to reset the display. |
| Zoom In |
|
Zoom in on the center of the current plot. Axes labels and annotations automatically resize. |
| Zoom Out |
|
Zoom out on the center of the current plot. Axes labels and annotations automatically resize. |
| Autoscale |
|
Rescales the plot data to fit the current window. |
| Orbital rotation |
|
Allows the plot to be spun freely around its middle point. |
| Turntable rotation |
|
Allows the plot to be spun around its middle point, but with the Z-axis constrained to not flip. |
| Reset camera to default |
|
Resets the plot area to default (45° from all axes). |
| Hide Infeasible Designs |
|
Hides/shows infeasible design points in the plot area and legend. |
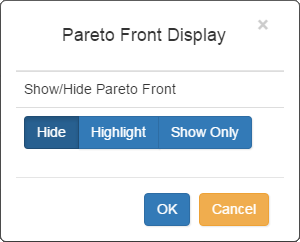
| Pareto Front Settings (2D Scatter Plot, 3D Scatter Plot) |
|
See here for more information on the Pareto front.
|
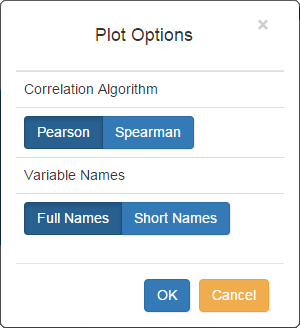
| Plot Settings |
|
|
| Show closest data on hover |
|
|
| Compare data on hover |
|
Requires at least 2 series in a plot. Displays separate tooltips for each data point with the same x axis value. |
| Show version info |
|
Displays a small window with the version information of the plotting widget. |


See Also Data Explorer