Determine a Global Positioning System Satellite Eclipse Period
STK Pro, STK Premium (Air), STK Premium (Space), or STK Enterprise
You can obtain the necessary licenses for this training by contacting AGI Support at support@agi.com or 1-800-924-7244.
The results of the tutorial may vary depending on the user settings and data enabled (online operations, terrain server, dynamic Earth data, etc.). It is acceptable to have different results. This tutorial requires an internet connection.
Capabilities Covered
This lesson covers the following STK Capabilities:
- STK Pro
- Analysis Workbench
Problem Statement
When a Global Positioning System (GPS) satellite is in an eclipse season, it may not receive enough solar exposure on its solar panels. If it doesn't the satellite could lose power. The angle between the orbital plane of a GPS satellite and the Earth-Sun vector, or beta angle, indicates when a given orbital plane is entering or has entered an eclipse season.
For this scenario, only six months of time will be evaluated for a GPS satellite eclipse season. You need to analyze an orbital plane for which you are responsible and determine when the beta angle was less than five degrees.
Solution
Use STK's Analysis Workbench (AWB) capability, including the Vector Geometry Tool (VGT) and Calculation tool, to model the beta angle for a GPS orbital plane over a six month period. This will determine when the satellite was in an eclipse season.
Throughout this tutorial, unless otherwise specified, use default settings.
Video Guidance
Watch the following video. Then follow the steps below, which incorporate the systems and missions you work on (sample inputs provided).
Create a New Scenario
Create a new scenario with a run time of six (6) months.
- Launch STK (
 ).
). - Click the Create a Scenario (
 ) button.
 - Enter the following in the STK: New Scenario Wizard:
- When you finish, click .
- When the scenario loads, click Save (
 ). A folder with the same name as your scenario is created for you.
 - Verify the scenario name and location and click Save.
| Option | Value |
|---|---|
| Name: | GPS_Eclipse |
| Start: | 1 Jan 2018 16:00:00.000 UTCG |
| Stop: | 1 Jul 2018 16:00:00.000 UTCG |
Save Often!
GPS Satellite
Insert a Satellite (![]() ) object which functions as the GPS satellite you are testing.
) object which functions as the GPS satellite you are testing.
- Use the Insert STK Objects tool (
 ) to insert a Satellite object (
 ) using the From Standard Object Database method.
 - Enter GPS in the Name or ID: field.
- Click .
- When the search is complete, go to the Results: list and in the Common Name column select SVN-48.
- Click .
- After SVN-48 propagates and is loaded into the Object Browser (Svn48_32711), close the Search Standard Object Data window.
SGP4 Propagator
The Simplified General Perturbations (SGP4) propagator is used with two-line mean element (TLE) sets. It considers secular and periodic variations due to Earth being oblate, as well as solar and lunar gravitational effects, gravitational resonance effects, and orbital decay using a drag model.
- Open Svn48_32711's () properties (
 ).
). - On the Basic - Orbit page, in the TLE Source field, click Preview.
STK queried the AGI Server to find the appropriate set of TLEs during the propagation interval for the specified SSC (in this case, 32711). Which TLEs are selected and how they are used is determined by the parameters on the Setup panel.
- Close the TLE Preview window.
- Click to close Svn48_32711's () properties ().
CelesTrak
For extensive information on TLEs, visit CelesTrak. It is the world’s first source for orbital element sets and related software and educational materials.
Not only is it the go-to place for this data today, but it was providing this service almost a decade before NASA started electronic dissemination and two decades before Space Track. It’s now been in operation for almost 33 years (since 1985).
In addition to TLEs—for which it has an extensive database than even the DOD—CelesTrak is the go-to place for GPS almanacs, space weather, and EOP data among satellite control centers around the world. And CelesTrak provided the first web-based conjunction assessment service, SOCRATES, which was the predecessor for today’s Space Data Center.
STK Reports
STK is shipped with many reports that provide lots of information. There are two reports that could provide the information needed to solve your problem. The Eclipse Times and Beta Angle reports could help you.
Eclipse Times Report
The Eclipse Times report takes into account the Earth and Moon as the central bodies for satellites orbiting the Earth. The report analyzes when the satellite enters umbra and penumbra of the central bodies.
- In the Object Browser, right-click on Svn48_32711 () and select the Report & Graph Manager.
- In the Styles list, select the Eclipse Times report and click .
This report provides a wealth of information. However, you are interested in the display times based on a specific angle drawn between an orbital plane and the Earth Sun vector.
- When finished with the report, close the report.
- Close the Report & Graph Manager.
Beta Angle Report
In the Beta Angle report, the beta angle defaults to measuring the angle between the satellite's orbital plane and the earth sun vector. This is exactly what you need to know for the six (6) month period being analyzed in this scenario. Due to the length of the analysis period, generating this report can take a long time and STK will display a warning explaining this. Therefore, only generate the report if you desire.
Neither report provides a graphical representation along with the analysis. This is where Analysis Workbench comes into play.
Display the Earth Sun Vector
The angle between the orbital plane of a GPS satellite and the Earth-Sun Vector, or beta angle, alerts you when a given orbital plane in the GPS constellation is entering an eclipse season. A beta angle of five degrees or less can be considered an eclipse period. You need to add the Earth-Sun vector and the orbital plane for the GPS satellite to this scenario. The Earth-Sun vector is predefined. Since the Earth-Sun vector displays originating from the Earth, you will add this vector via your 3D Graphics window properties.
- Open the 3D Graphics window's properties ().
- Select the Vector page.
- Select the Show check box beside the Earth Sun Vector.
- Select the Show Label check box.
- Scroll down to Common Options.
- Set the Scale value for the Component Size section to 4.0.
- Click .
The Earth-Sun vector is now clearly visible in the 3D Graphics window.
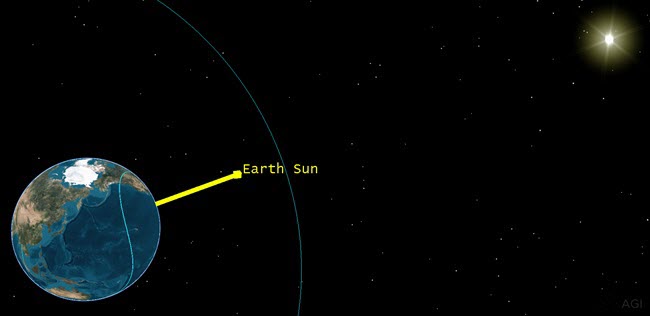
Earth Sun Vector
Create an Orbital Plane
Now you can create the orbital plane for the GPS satellite using the Vector Geometry Tool inside the Analysis Workbench. You want the plane that you are going to create to be a child of the Earth rather than the satellite. Having Earth as the parent object allows you to duplicate and modify the orbital plane in the future to represent the other orbital planes in the GPS constellation.
The orbital plane is defined as the plane perpendicular to (normal to) the satellite’s orbital angular momentum; therefore, you can use the Normal type for the plane that you create. In order to properly construct this plane, you need to define two vectors and a reference point.
- Click the Analysis Workbench (
 ) icon in the STK Tools toolbar.
 - Ensure the Vector Geometry tab is selected.
- Change the Filter by: field to All Objects.
- In the Objects list, select Earth.
- Click the Create new Plane (
 ) icon and set the following:
| Option | Value |
|---|---|
| Type: | Normal |
| Name: | Plane_Svn48 |
Define A Normal Vector
The Normal Vector is a unit vector perpendicular to the plane of an elliptical orbit created from the motion of the specified point with respect to the center of the specified central body. At any time, the orbit is fit to the current motion of the specified point according to the specified type orbital elements. Available types are:
- osculating
- Brouwer-Lyddane long
- Brouwer-Lyddane short
- Kozai
The unit vector is directed along the current orbit angular momentum of the specified point with respect to the specified central body.
- Click the Normal Vector: ellipses button (
 ).
). - Select Svn48_32711 in the Objects list.
- Select Orbit_Normal in the Vectors for: Svn48_32711 list.
- Click .
Define the Reference Vector
The Reference Vector determines where the axes of the plane are positioned, and sets up how the X and Y axes of the plane are oriented. Align the X axis with the satellite’s ascending node.
- Click the Reference Vector: ellipses button ().
- Select Svn48_32711 in the Objects list.
- Select LineOfNodes in the Vectors for: Svn48_32711 list.
- Click .
- Click to close the Add Geometry Component window.
Reference Point
Since the orbital plane will pass through the Earth, you can keep the Earth Center as the reference point.
Display the Orbital Plane
- Bring the 3D Graphics window to the front.
- Open the 3D Graphics windows properties ().
- Select the Vector page.
- Select the Planes tab.
- Click the button.
- Select Earth in the Objects list.
- Select Plane_Svn48 in the Components for: Earth list.
- Click .
- Enable the Translucent plane option.
- Click .
Display the Line of Nodes Vector
You used the line of nodes vector as the reference axis for the plane that you created. It should line up along the x-axis of Plane_Svn48 when displayed.
- Select the Vectors tab.
- Click the button.
- In the Add Components window, select Svn48_32711 in the Objects list.
- Select LineOfNodes in the Components for: Svn48_32711 list.
- Click .
- Click to accept your changes and to close the 3D Graphics window properties.
- Bring the 3D Graphics window to the front.
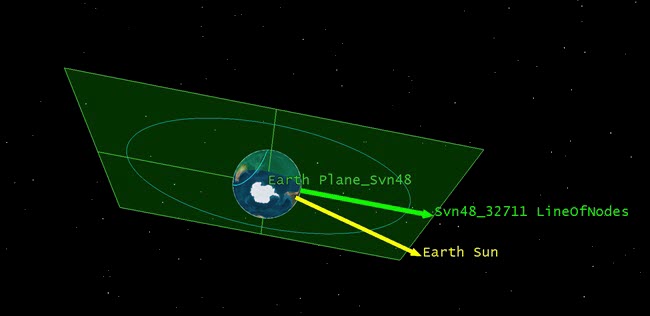
Orbital Plane and Line Of Nodes
Define the Beta Angle
For the purposes of this lesson, the beta angle is defined as the angle between the orbital plane of the satellite and the vector to the sun. The beta angle is the smaller angle (there are two angles) between the Sun vector and the plane of the satellite's orbit.
- Return to the Vector Geometry tool.
- Select Earth in the objects list.
- Click the Create New Angle (
 ) button and set the following:
 - Click to close the Add Geometry Component window.
| Option | Value |
|---|---|
| Type: | To Plane |
| Name: | Beta Angle |
| Reference Vector: | Sun (Earth Sun) |
| Reference Plane: | Plane_Svn48 (Earth Plane_Svn48) |
| Signed | On |
| Toward plane normal: | Positive |
If Signed is selected, the angle can be measured as either Positive or Negative when the reference Vector is directed toward the plane’s normal. Otherwise, the angle is measured as positive regardless of on which side of the plane the reference vector is located.
Display the Beta Angle in 3D
- Bring the 3D Graphics window to the front.
- Open the 3D Graphics window properties.
- Select the Vector page.
- Select the Angles tab.
- Click the button.
- Select Earth in the Objects list and Beta_Angle in the Components for: Earth list.
- Click .
- Clear the Show label check box.
- Select the Show angle value check box.
- Click to accept your changes and to close the 3D Graphics window properties.
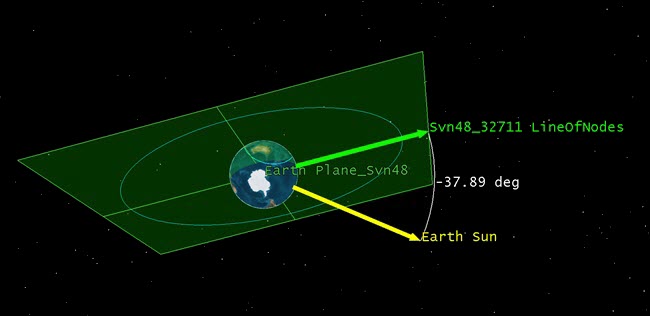
Beta Angle
Animate the Scenario
- In the Animation Toolbar, increase (
 ) the Time Step: to 7200.00 sec.
 - Click the Start (
 ) button. You can see the angle change over the six month analysis period.
 - When finished, click the Reset (
 ) button.
Calculation Tool
For this problem, you want to know when the beta angle is between -5 degrees and five (5) degrees. This can be accomplished quickly using the Calculation tool. You can use the Calculation tool to combine system data with algebraic, functional, and calculus operations to extend models and define new data providers with custom algorithms from 20 mathematical operations.
Scalar Calculation
Scalars define components that produce scalar time-varying calculations.
- Return to the Analysis Workbench.
- Select the Calculation tab.
- Select Earth in the objects list.
- Click the Create new Scalar Calculation (
 ) button and set the following:
 - Click .
| Option | Value |
|---|---|
| Type: | Angle |
| Name: | Beta Angle Angle |
| Input Angle: | Earth Beta_Angle |
Condition
Conditions define a scalar calculation which is considered to be satisfied when it is positive and not satisfied when it is negative.
- Select Earth in the Objects List.
- Click the Create new Condition (
 ) button and set the following:
 - Click .
| Option | Value |
|---|---|
| Type: | Scalar Bounds |
| Name: | Eclipse Season |
| Scalar: | Earth Beta_Angle_Angle |
| Operation: | Between Minimum and Maximum |
| Minimum: | -5 deg |
| Maximum: | 5 deg |
Set the Report Units
- In the Components for: Earth list, expand () Eclipse_Season.
- Right-click on SatisfactionIntervals and select Report.
- In the report's toolbar, select Report Units.
- Select the Time Dimension.
- In the New Unit field, select Days (day).
- Click .
The report gives you the exact dates and times, during the six (6) month test period, that Svn48_32711 entered and exited the eclipse season based on the conditions set for the beta angle.
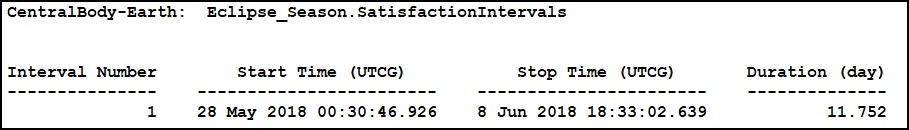
Eclipse Season Report
View the Beta Angle in 3D
- In the report, right-click on the Start Time, select Start Time, and then select Set Animation Time.
- Click the Save as quick report (
 ) button.
 - Close the report.
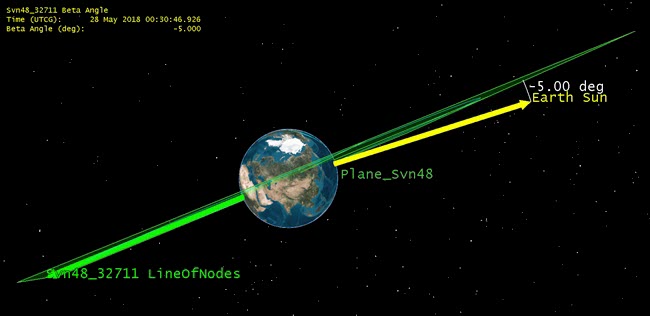
- Bring the 3D Graphics window to the front. You can see the beta angle is -5 degrees.
Data Display
You can use the 3D Graphics properties for Svn48_32711 to display dynamic data in the 3D Graphics window concerning the beta angle. This feature is useful when presenting information that requires both visual and textual data.
- Open Svn48_32711's () properties ().
- Select the 3D Graphics - Data Display page.
- Click the button.
- In the Add a Data Display window, select Beta Angle.
- Click .
- Adjust any Position and/or Appearance settings that you desire and click .
Beta Angle and Data Display
You now have a report with the eclipse dates based on the beta angle and beta angle data in the 3D Graphics window. If required, this makes good use of STK to build a briefing on the satellite that requires both analysis and graphics.
Animate the Scenario
- In the Animation Toolbar, click the Start () button to view the satellite as it passes through its eclipse season.
- When finished, click the Reset () button.
Save Your Work
- Close the Analysis Workbench.
- Save () your work.