STK Premium (Space), or STK Enterprise
You can obtain the necessary licenses for this training by contacting AGI Support at support@agi.com or 1-800-924-7244.
Additional installation - Analyzer. You can obtain the necessary install by visiting http://support.agi.com/downloads or calling AGI support.
The results of the tutorial may vary depending on the user settings and data enabled (online operations, terrain server, dynamic Earth data, etc.). It is acceptable to have different results.
Capabilities covered
This lesson covers the following STK Capabilities:
- STK Pro
- STK SatPro
- Coverage
- STK Analyzer
Problem statement
Engineers and operators require a quick and easy way to generate a Walker constellation to study future satellite constellation designs. A Walker constellation consists of a group of satellites that are in circular orbits and have the same period and inclination. A small constellation of satellites employing synthetic-aperture radars (SAR) will be used to create three-dimensional reconstructions of the Earth's land masses. The analysis will require the use of shapefiles. Another requirement is a trade study tool which they can use to quickly perform "what if" analysis, collect data from, and use to optimize the scenario.
Solution
Use STK's SatPro, Coverage, and Analyzer capabilities to create an STK scenario and run trade studies. The trade studies will help determine what your coverage of the Earth's land masses will be over a 24-hour period, considering different variations of altitude on your satellites.
What you will learn
Upon completion of this tutorial, you will have a basic understanding of the following:
- The Walker Tool
- Coverage and Shapefiles
- Analyzer
Video guidance
Watch the following video. Then follow the steps below, which incorporate the systems and missions you work on (sample inputs provided).
Create a new scenario
Create a new scenario.
- Launch STK (
 ).
). - In the Welcome to STK window, click Create a Scenario (
 ).
). - Enter the following in the New Scenario Wizard:
- When finished, click .
- When the scenario loads, click Save (
 ). A folder with the same name as your scenario is created for you in the location specified above.
 - Verify the scenario name and location.
- Click .
| Option | Value |
|---|---|
| Name: | Walker_Analyzer |
| Location: | Default |
| Start: | 1 Mar 2021 16:00:00.000 UTCG |
| Stop: | 2 Mar 2021 16:00:00.000 UTCG |
Save Often!
Turn off Terrain Server
Terrain will not be used in this analysis.
- Open Walker_Analyzer's () properties (
 ).
). - Select the Basic - Terrain page.
- Clear the Use terrain server for analysis option.
- Click .
Create a seed satellite
The original satellite that is used to create the Walker constellation is referred to as the “Seed” satellite. The satellites generated using the Walker tool are referred to as "children". Use the Orbit Wizard to create the “seed” satellite from which the other satellites will be derived.
- Select Satellite (
 ) in the Insert STK Objects tool.
 - Select the Orbit Wizard (
 ) method.
 - Click .
- Set the following on the Orbit Wizard:
- Note the default Approximate Altitude.
- Click .
| Option | Value |
|---|---|
| Type: | Repeating Ground Trace |
| Satellite Name: | Sar_Sat |
Synthetic Aperture Radar (SAR) sensor
The Synthetic Aperture Radar (SAR) sensor type synthesizes the aperture of a larger antenna than is actually present, using SAR pattern definitions designed to model the field of regard of a SAR sensor onto the surface of the earth.
Insert a Sensor object
Insert a Sensor object that will be used to model the synthetic aperture radar on the satellite.
- Select Sensor (
 ) in the Insert STK Objects tool.
 - Select the Define Properties () method.
- Click .
- Select Sar_Sat () in the Select Object window.
- Click .
- Rename the sensor () Sar_Sens.
Define the SAR
- Select Sar_Sens's () Basic - Definition page.
- Set the Sensor Type: to SAR.
- Set the following Elevation Angles:
- Set the following Exclusion Angles:
- Select Track parent altitude.
- Click to accept the changes and close the Properties Browser.
| Option | Value |
|---|---|
| Min: | 50 deg |
| Max: | 90 deg |
| Option | Value |
|---|---|
| Forward: | 70 deg |
| Aft: | 70 deg |
Walker constellations
You have defined a satellite with the characteristics and orbit you need. You will use the Walker Tool to generate a Walker constellation. For your preliminary analysis, two satellites in one orbital plane are required.
- Right-click on Sar_Sat () in the Object Browser.
- Select Satellite .
- Select Walker...
- Set the Number of Planes: to 1 in the Walker Tool.
- Click .
- Click .
Walker satellite relationships
When a Walker constellation is created, each child has the same base name as the seed satellite plus two numbers.
- The first number identifies the plane in which the satellite resides
- The second identifies the satellite's position in the plane
For instance, here you define a Walker constellation with one plane and two satellites per plane. Sar_Sat12 would be the second satellite in the first plane.
If the seed satellite has sub-objects such as sensors, the sub-objects are also created for each of the child satellites.
If you keep the seed satellite in the scenario, two identically configured satellites (the seed satellite and the first satellite in the first plane) will be considered in your analysis. To prevent duplicate analysis, we will remove the seed satellite. But first, you will save the scenario. It is important that you save the scenario before you remove Sar_Sat as you need to reload it later for further analysis. It will be removed from the scenario, but not from the folder where the scenario is saved.
- Save () your scenario.
- Right-click on Sar_Sat () in the Object Browser.
- Select Delete (
 ).
).
Create a Constellation
Each resulting Walker satellite has an instrument associated with it, represented by a Sensor object in STK. You will be using these sensors to examine your coverage of the Earth's land masses. Group the sensors together in a constellation so that they can be considered as a group for analysis purposes.
- Select Constellation (
 ) in the Insert STK Objects tool.
 - Select the Define Properties () method.
- Click .
- Select the Basic - Definition page.
- Select both Sensor () objects in the Available Objects list.
- Move (
 ) them to the Assigned Objects list.
 - Click .
- Rename the Constellation () Sar_Sensors.
Land mass coverage
You want to assess coverage over the Earth's land masses. To do this, you will assess coverage of the land masses that is based on the boundaries of a shapefile (.shp). You will need to specify the region being examined, how each grid point should be treated, and what assets will be used to examine the region.
Insert a Coverage Definition
Insert a Coverage Definition to model the area that will be analyzed.
- Select Coverage Definition (
 ) in the Insert STK Objects tool.
 - Select the Insert Default () method.
- Click .
- Rename the coverage definition () Land_Cov.
Define the Coverage Grid Area of Interest
You will define the Coverage Grid Area of interest with a Custom Region. In the Select Regions window, you can choose to define the area using the boundary points of an existing area target, one or more region list files (*.rl) or shapefiles (*.shp), or both. Shapefiles are common in the Geographic Information Systems (GIS) community for sharing geographic data and the format was developed by Esri (the Environmental Systems Research Institute).
Shapefiles and region list files have an advantage over STK area targets because they support defining polygons with holes. The interior of a polygon is defined to be the area to the right side of the line made by following the points defining the polygon (clockwise). You can therefore create holes in polygons by creating a polygon that overlaps another and has its points defined in the opposite (counterclockwise) order.
- Open Land_Cov's () properties ().
- Select the Basic - Grid page.
- Change the Grid Area of Interest Type: to Custom Regions.
- Click ..
- Click ..
- Browse to the location of the land shapefiles installed with STK (typically, <C:\Program Files\AGI\STK 12\Data\Shapefiles\Land>).
- Select Land.shp.
- Click .
- Click .
Specify the Point Granularity
Define the point granularity with Lat/Lon spacing of four degrees.
- Change the Point Granularity to Lat/Lon 4 deg.
- Click to accept the changes and keep the Properties Browser open.
View the Grid
View the Coverage Grid in the 2D Graphics window
- Bring the 2D Graphics window to the front.
- Notice the Coverage grid points only on the land masses.
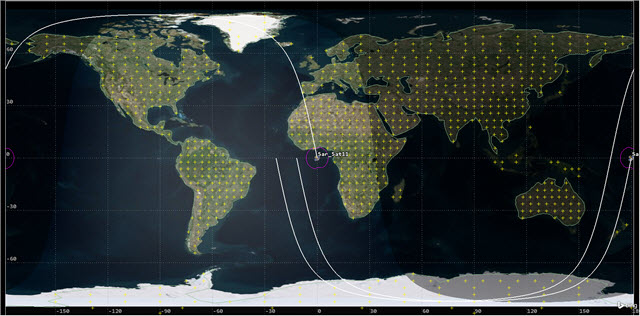
Land Mass Coverage Grid
Select Coverage Assets
Set the satellite sensors as the Coverage Assests. Assets properties allow you to specify the STK objects used to provide coverage
- Return to Land_Cov's () properties ().
- Select the Basic - Assets page.
- Select Sar_Sensors () from the Assets list.
- Click .
- Click .
Turn off Automatically Recompute Accesses
Advanced properties allow you to adjust the manner in which access information is stored and computed. You will turn off the Automatically Recompute Accesses option. It is recommended to turn off the auto recompute access feature prior to making a number of asset modifications to avoid recomputing multiple times. Remember to Compute Accesses or turn the auto recompute feature back on after all changes have been applied so it will trigger an update of the access information.
- Select the Basic - Advanced page.
- Clear Automatically Recompute Accesses.
- Click .
Compute Accesses
The ultimate goal of coverage is to analyze accesses to an area using assigned assets and applying necessary limitations upon those accesses. Now that your Coverage Definition is defined, Compute Accesses.
- Right-click Land_Cov () in the Object Browser.
- Select CoverageDefinition.
- Select Compute Accesses.
- Observe Coverage computing in the 2D and 3D Graphics windows.
Figures of Merit
STK allows you to specify the method by which the quality of coverage is measured using a Figure Of Merit object. The default figure of merit is Simple Coverage. Simple Coverage measures whether or not a point is accessible by any of the assigned assets.
- Select Figure Of Merit (
 ) in the Insert STK Objects tool.
 - Select the Insert Default () method.
- Click .
- Select Land_Cov () in the Select Object window.
- Click .
- Rename the Figure of Merit () Simple_Cov.
View the Coverage
View the Coverage in the 3D Graphics window.
- Bring the 3D Graphics window to the front.
- Observe the Simple Coverage over the land masses.
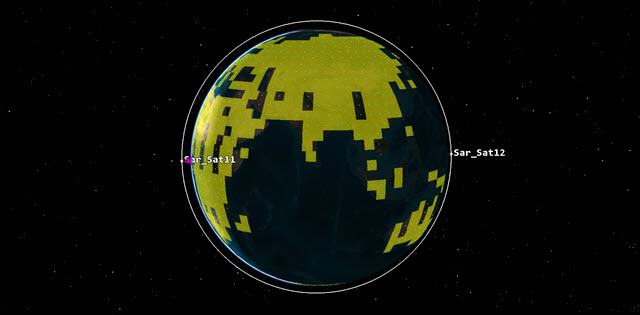
Simple Coverage
Determine Static Satisfaction
Generate a Percent Satisfied report to determine the amount of land that is covered by at least one sensor over the 24 hour analysis time period. Static Satisfaction reports the amount of the coverage analysis grid which satisfies satisfaction criteria defined in the figure of merit based on the static definition of the figure of merit. The Data Provider Elements are Percent Satisfied and Area Satisfied.
- Right-click on Simple_Cov () in the Object Browser.
- Select Report & Graph Manager (
 ).
). - Expand (
 ) Installed Styles folder in the Styles list.
 - Select the Percent Satisfied report (
 ).
). - Click .
- Note the % Satisfied value at the bottom of the report (e.g. ~90 percent).
- Close the report.
- Close the Report & Graph Manager ().
You can see that the Walker constellation you created has left you short of covering 100 percent of the land mass. You could adjust your satellites and redo your analysis at a variety of altitudes. It would be tedious to repeat the entire scenario time and time again for each altitude that you want to test. Instead, you can use Analyzer to automate such a study.
Clean up
As you perform a parametric analysis, Analyzer will create new Walker constellations and associated sensors. Take a moment to remove the existing Walker satellites.
- Select both of the Sar_Sat Satellite () objects in the Object Browser.
- Right-click on one of the selected satellites in the Object Browser.
- Select Delete ().
Reload the Sar_Sat seed satellite
Reload the original Sar_Sat satellite that you created.
- Select Satellite () in the Insert STK Objects tool.
- Select the From Satellite File (.sa) (
 ) method.
 - Click .
- Navigate to the directory where you saved the scenario.
- Select Sar_Sat.sa.
- Click .
- Save () your scenario.
Update the Constellation object
Since you removed the Walker satellites, you will need to update the Constellation object. The Constellation object will still be assigned inside the Coverage Definition object.
- Open Sar_Sensor's () properties ()
- Select the Basic - Definition page.
- Select Sar_Sens () in the Available Objects list.
- Move () Sar_Sens () to the Assigned Objects list.
- Click .
Analyzer
Analyzer is integrated into the STK workflow to help you automate and analyze STK trade studies in order to better understand the design of your system. For purposes of this tutorial, Analyzer will be used to:
- Parametrically explore the STK design space in order to analyze your scenario.
- Perform parameter studies that vary an input variable through a range of values and plot one or more output variables.
Launch Analyzer
You are ready to use Analyzer, so let's open it.
- Select Analysis in the menu bar.
- Select Analyzer.
- Select Analyzer... (
 ).
).
Assign the input variables
Set up Analyzer to use the appropriate input variables for your analysis.
- Select Sar_Sat () in the STK Variables list.
- Expand () Propagator (J2Perturbation) in the STK Property Variables list.
- Select SemiMajorAxis in the STK Property Variables list.
- Drag and drop the SemiMajorAxis variable in the Analyzer Variables list on the right side of the Analyzer window.
- Select the Walker folder in the STK Property Variables list.
- Drag and drop the Walker folder in the Analyzer Variables list. This adds all the Walker variables to the list.
Assign the output variable
Set up Analyzer to use the appropriate output variable for your analysis.
- Expand () Land_Cov () in the STK Variables list.
- Select Simple_Cov ().
- Expand () Static Satisfaction in the Data Provider Variables list.
- Select Percent Satisfied.
- Drag and drop the Percent Satisfied variable in the Analyzer variables list. Analyzer automatically assigns Percent Satisfied as an output variable.
The Parametric Study Tool
You have entered your input and output variables. You only want to vary one variable, so you can use the Parametric Study Tool to run a model through a sweep of values for some input variable. The resulting data can be plotted to view trends.
You need to tell Analyzer that you want to:
- Adjust the altitude of our “seed” satellite, Sar_Sat
- Use the resulting Sar_Sat to generate a Walker constellation
- Place the resulting Walker sensors into a constellation that can be used to calculate coverage
Define the Design Variable
Open the Parametric Study tool, note the SemiMajorAxis altitude in the Components Tree, and define SemiMajorAxis as the Design Variable for your study. In the Orbit Wizard, this was stated as approximately 400 km which is determined from the surface of the WGS84 ellipsoid. Analyzer uses semi-major axis.
You will run a study starting at a semi-major axis of 6900 km through 7100 km in 50 km increments. This will take a total of five runs.
- Click Parametric Study... (
 ) on the Analyzer toolbar.
 - Select SemiMajorAxis in the Components Tree.
- Drag and drop the SemiMajorAxis variable in the Design Variable field on the right.
- Set the following values below the Design Variables box:
| Option | Value |
|---|---|
| starting value: | 6900 |
| ending value: | 7100 |
| step size: | 50 |
Set up the Walker Variable
Set up the Walker variable so when the study runs it populates two satellites in one orbital plane and adds the sensors into the sensor constellation.
- Return to the components list.
- Set the following Walker variables by clicking in the value field:
| Option | Value |
|---|---|
| Enable | true |
| Walker Type | Delta |
| Constellation | Sar_Sensors (you must type this exactly as it appears in your scenario) |
| Constellation Type | Sensor |
| numPlanes | 1 |
| numSatPerPlane | 2 |
| RAAN Spread | 360 |
| walkerParam | 0 |
Define the Responses
Just like you did with the Figure Of Merit object, you're looking for changes in Percent Satisfied at each semi-major axis change. Set Percent Satisfied as the Response for your parametric study.
- Select Percent_Satisfied in the Components tree.
- Drag and drop Percent_Satisfied to the Responses list.
Run the parametric study
Now that you defined the Design Variable, Walker variable, and Response, run your study.
- Click .
- Take a look at the Object Browser and the 2D and 3D Graphics windows. You will see the various Walker constellations being created and the coverage calculations progressing.
Be patient. It will take several minutes to analyze the different scenarios.
Review your results
Take a look at the 2D Scatter Plot graph in the Data Explorer. You can edit the graph to make it easier to read.
- Click Add View in the 2D Scatter Plot window.
- Select 2D Line Plot.
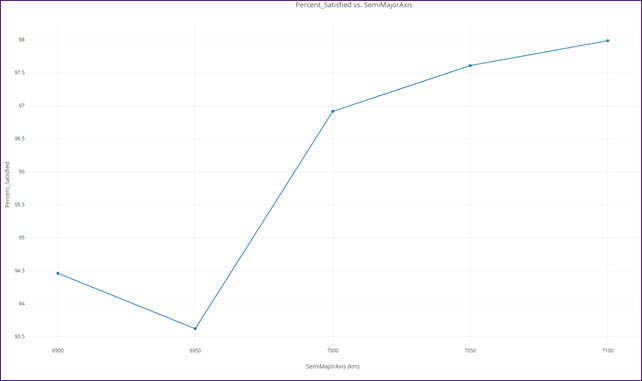
Percent Satisfied versus Semi-major Axis
Look at the table data
Look at the table data which provides more specific data about the points on the graph.
- Bring the Table window to the front.
- Take a look at the summary of the input and output values.
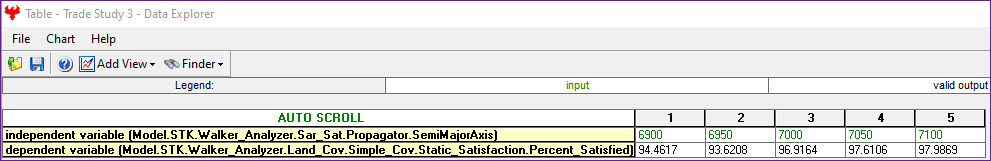
Table Data
The numbers listed above are meant to show you want the results summary looks like and are not intended as specific Analyzer results. Your results may vary from those shown.
Final analysis
Use the data provided in the Data Explorer to answer the following questions:
- Do you achieve 100% coverage of the land masses with any of the constellations created?
- If not, how close do you come to 100% coverage?
- Between which two semi-major axis altitudes did you gain the greatest coverage percentage?
- Between which two was your gain the least?
- How would you change your Analyzer set up if you wanted to see Area Satisfied instead of Percent Satisfied?
This tutorial is an introduction to the Walker tool and Analyzer. Simple values where used in order to expose you to their functionality.
Summary
You began the scenario by placing a Satellite object in a repeating ground trace orbit. You attached a Sensor object to the Satellite object that created a synthetic aperture radar field of regard. Using the Satellite object as a seed satellite and the Walker tool, you created a simple constellation of two satellites opposite of each other in one orbital plane. Using a Coverage Definition object, you assigned a shapefile as your grid area of interest which covered all the Earth's land masses and assigned the Sensor objects as the assets. Using a Figure Of Merit object and Simple Coverage, you determined that approximately 90 percent of the Earth's land mass was accessed by the Sensor objects during a twenty four hour analysis period. Using Analyzer's Parametric Study Tool, you varied the Satellite object's semi-major axis to study percent satisfied at various altitudes.
On your own
Throughout the tutorial, hyperlinks were provided that pointed to in depth information of various tools and functions. Now is a good time to go back through this tutorial and view that information. You could rerun all the Parametric studies using new values with the existing input variables. You could add new semi-major axis inputs and study how that affects coverage. A different approach might be to add an input that changes the size of the Sensor object's field of regard. There are a lot of combinations you could try. Explore and have fun!