Understand Scenario Trends
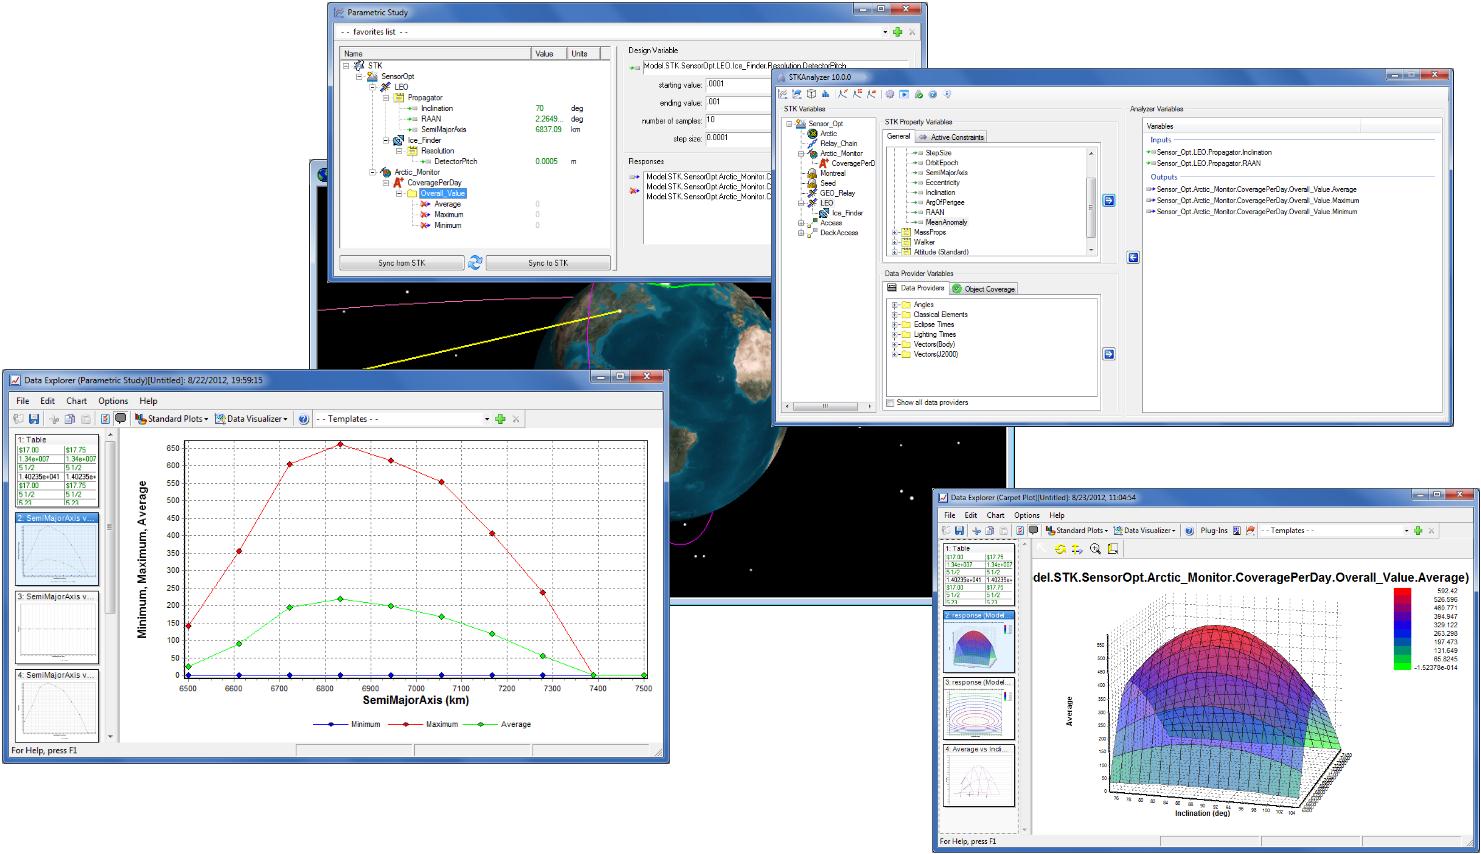
After creating a Scenario in STK, there is often a need to verify its accuracy and visualize/understand overall trends. Using the Parametric Study Tool, Carpet Plot Tool, and DOE Tool, you can systematically vary one or more of your input variables, run your scenario, and tabulate and visualize the results using line, surface, contour, and carpet plots. With these tools, you can gain a basic understanding of scenario trends and verify that the predictions of your scenario agree with your expectations.
After running a trade study and generating some data, The Variable Influence Profiler and Prediction Profiler (included in the STKOptimizer package) can help you identify the most influential variables in your scenario, visualizing portions of the design space, and interactively searching for improved designs.
Parametric Study
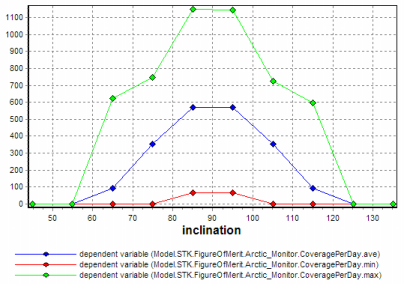
When conducting a parametric study, you typically vary the value of a single input variable and interactively see the resulting changes in all of the output variables. This can be very useful for understanding overall behavioral trends in your model and for verifying that the model is working properly and generating results that make engineering sense.
Carpet Plot
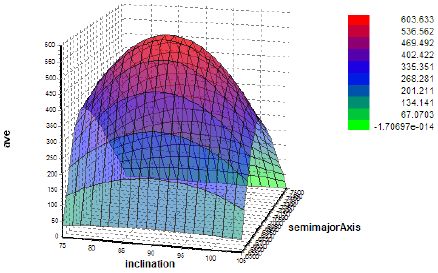
A carpet plot allows you to vary the values of any two input variables and see the resulting changes in an output variable. It can be thought of as a two-dimensional parametric study. The carpet plot is an alternative way to visualize and interpret the results of a two-dimensional parametric study. In a carpet plot, the output variable is plotted on the vertical axis, and interlocking contours lines representing constant values of each of the two input variables are drawn to create a trade-off "surface". Constraint lines can be superimposed on the plot to indicate regions of feasible and infeasible designs.
Design of Experiments
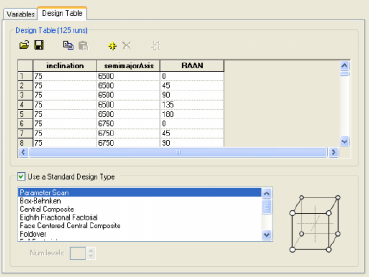
Using Design of Experiments, you can gather information about your model's behavior by running it for a number of different input variable combinations. The DOE tool is a convenient way to begin exploring your design space, and is often the starting point for performing more sophisticated model analyses using, for example, the Variable Importance Profiler or Prediction Profiler. You can perform n-dimensional parametric studies by specifying the number of samples for each of the input variables or you can choose from a variety of pre-defined "experimental designs". These experimental designs include a wide range of standard experiments, as follows:
- Full Factorial
- Half, Eighth, Sixteenth Fractional Factorial
- Central Composite
- Face Centered Central Composite
- Box-Behnken
- Foldover
- Plackett-Burman
- Taguchi-Two Level Orthogonal Array
- Latin Hypercube
In addition, you can define your own custom experiment.
See Also Parametric Study Tool | Carpet Plot Tool | DOE Tool | Probabilistic Analysis | Optimization | Data Explorer