Spectrum Analyzer
The Spectrum Analyzer is similar in nature to a real spectrum analyzer instrument, but with some extra features tailored toward STK. The Spectrum Analyzer enables you to view the spectrum use in different ways. It has various modes to help you understand the currently assigned emitter frequency allocations as well as when and how “hot” the spectrum band is currently being utilized. You can visualize the total spectrum use and intensity from the perspective of what a specific receiver, at some geographical position, may encounter. It can show the emitters as itemized power spectrum densities at an instantaneous time or as a total over a window of time.

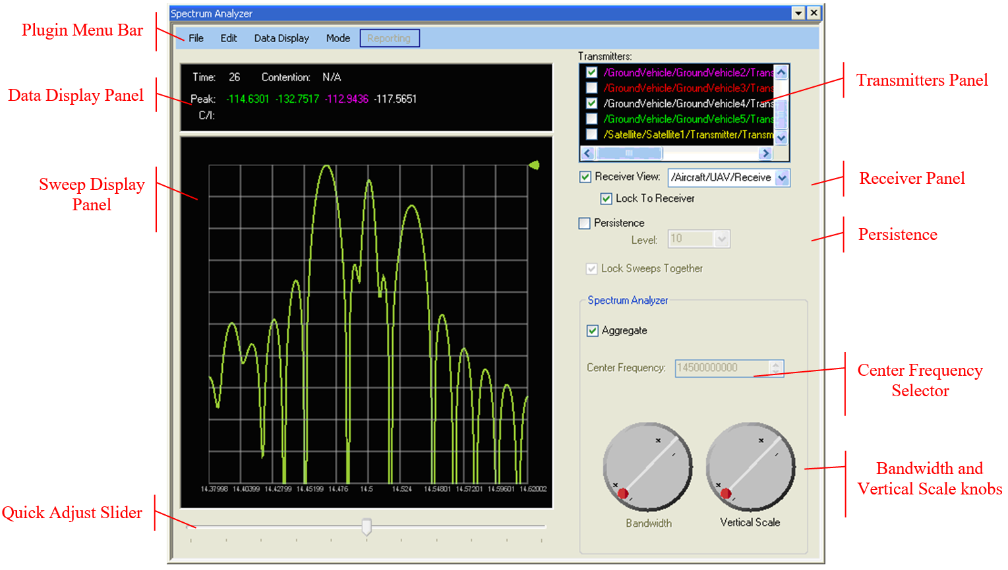
The Spectrum Analyzer’s various panels, controls, and modes are described below.

Toolbar
Upon loading a scenario, if the Spectrum Analyzer toolbar is not currently displayed right-click STK’s main window to bring up the Available Toolbar context menu. From the menu, select Spectrum Analyzer. If the toolbar shows no icons, click the small drop-down arrow and select Reset Toolbar. The toolbar contains one icon. Clicking the icon will launch a new instance of the Spectrum Analyzer.
Data Display Panel
The Data Display panel displays important information and values associated with each time step. There are two items that are always displayed as well as a set of items that can be selected for display. The items that are always displayed include:
Time. Current time step.
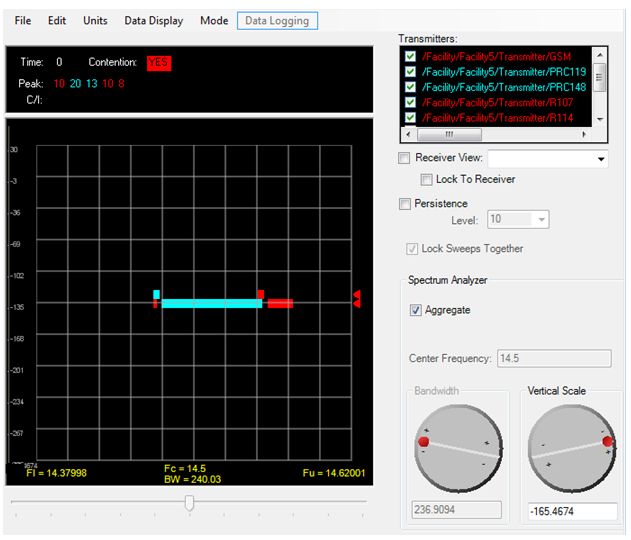
Contention. Displays YES when two transmitters overlap in their frequency bands. Applicable for Spectral Contention Mode, and is particularly useful when the Transmitter Object’s Use Signal PSD is turned off as it will show whether a spectrum conflict exists between different transmitters. This item cannot be disabled.
For a list and explanation of the items that are user selectable see Data Display Menu.
Sweep Display Panel
The Sweep Display panel displays Sweeps that represent various views of a signal. The Sweep Display panel’s horizontal axis represents frequency in units specified in the Units Menu Item. The vertical axis depends on the selected display mode (as set in the Mode menu item). The horizontal axis displays information, which includes lower frequency limit (Fl), upper frequency limit (Fu), center frequency (Fc), and bandwidth (BW).
Transmitter Panel
The Transmitters panel displays the names of all the transmitters within the scenario. When new transmitters are added to the scenario, they will automatically show up in the Transmitter panel. When transmitters are removed from the scenario, they will automatically be removed from the Transmitter panel. If a transmitter (or its parent) is renamed, it will automatically be updated, too.
Transmitter Color
The transmitter’s sweep default color can be overridden with the Spectrum Analyzer by right-clicking on the transmitter name. Right-clicking the name will bring up a color selection dialog. After changing the color of the transmitter, the next time the sweep is drawn it will be drawn in the new color.
When the transmitter’s sweep color is changed, it only changes the color within the Spectrum Analyzer, it will not change the color being used by the STK object’s 2D/3D graphics. To change the color of the STK object’s 2D/3D graphics, you need to change it in the STK Object’s property page. Also, changing the STK object’s 2D/3D graphics color will not change the color utilized within the Spectrum Analyzer unless the Spectrum Analyzer window is closed and re-opened.
Selecting Transmitters
At start-up, all transmitters are turned off. To turn on or turn off a transmitter, check or clear its check box located to the left of the name. Turning on a transmitter will display its Power. For a detailed description of the Power Spectrum Density being displayed in the Sweep Display panel, see Receiver View.
Receiver Panel
The Receiver panel displays the names of all the receivers within the scenario which are neither Bandwidth Auto-scaled nor Frequency Auto-Tracking. When new receivers (non auto-scaled and non auto-tracking) are added to the scenario they will automatically show up in the Receiver panel’s Receiver View list. When receivers are removed from the scenario, they will automatically be removed from the Receiver panel’s Receiver View list. If a receiver (or their parent) is renamed, it will automatically be updated too.
Receiver View
Checking the Receiver View check box automatically adjusts the Sweep Display panel to show the frequency band that is seen by the selected receiver (provided the Lock To Receiver is checked). Selecting a different receiver will change the horizontal axis of the Sweep Display panel to the band as seen by the newly selected receiver. When the Receiver View is checked, the Sweeps are those at the location of the receiver (i.e., the signals the receiver would see). When the Lock To Receiver is checked, the Bandwidth control, Center Frequency control, and Quick Adjust Slider will be disabled.
When the Receiver View is not checked, the Sweeps are those at the output of the transmitter (i.e., what is being transmitted into the channel medium), and the Sweeps are independent of the channel, Doppler, polarization, and receiver front-end effects.
Lock To Receiver
The Lock To Receiver check box is provided in the event that you want to change the band to “inspect” what is happening in an area of the spectrum outside the receiver. Clearing this check box will enable the Bandwidth control, Center Frequency control, and Quick Adjust Slider to be enabled. The propagation effects, Doppler, and receiver front-end effects will still be included in the Sweep’s PSD and any displayed Data Display values.
Persistence
Checking persistence will provide some past time step sweeps to be displayed along with the current time sweep. Each older time step sweep is displayed in a slightly darker shade. Persistence enables you to see what happened in the past (up to 10) time steps and will also produce an effect that is like the older hardware phosphor displays. Checking the Persistence check box will enable the Persistence Level. The persistence feature is only enabled for PSD Mode.
Persistence Level
The persistence Level allows up to 10 past sweeps to be displayed along with the new sweep. This allows the ability to see past information within an instantaneous time display.
Horizontal Scale Settings
Allows the x-axis of the Sweep Display to be changed.
Center Frequency
Sets the Sweep Display to be centered to the Center Frequency value (in units as selected in the Units->Frequency menu). When both the Receiver View and the Lock To Receiver is checked, this will be grayed out.
Bandwidth
Sets the Sweep Display width such that the displayed bandwidth is the specified value (in units as selected in the Units->Bandwidth menu).
Aggregate
Checking Aggregate will display only one sweep which is a summation of all enabled transmitter sweeps. This is only enabled for PSD Mode.
Bandwidth and Vertical Scale Knobs
The Bandwidth knob will increase or decrease the bandwidth, which is shown in the Sweep Display panel. You can click on the knob for single adjustment or you can click and drag to have continuous and instantaneous updates to the Sweep Display panel.
Left-mouse-click in the “+” half will increase the value of each grid division of the Sweep Display panel. Left-mouse-click in the “-” half will decrease the value of each grid division of the Sweep Display panel. Holding the left mouse down while rotating clockwise will increase the value of each grid division of the Sweep Display panel, while a counter-clockwise motion will decrease the value of each division.
An increase or decrease of the Bandwidth knob will increase or decrease the bandwidth of the visible spectrum within the Sweep Display panel, respectively. Just the same, an increase or decrease of the Vertical Scale knob will increase or decrease the value of the y-axis divisions.
Menu Bar
Edit Menu
Properties.... Brings up the Properties Dialog window.
Properties Dialog
Display Delay. Allows the animation to be slowed down.
Sweep Line Width. Increases or decreases the thickness (in pixels) of the drawn sweeps.
Fade Factor. Used to determine how much each Persistent level fades. A fade factor of 0.7 will keep 70% of the previous sweep (i.e., fades each sweep by 30%).
Show Cursor Lines. Enables and disables the Cursor Display Lines in the Sweep Display panel.
Units Menu
Enables you to change the units for various measurements. Currently, only units for Frequency, Bandwidth, and Power measurements are supported. Changing the units will change how the values are displayed in the GUI control panels, Data Display panel, and the Sweep Display panel.
Data Display Menu
Lists all the items that can be displayed in the Data Display panel. Enabling these could incur a small amount of overhead when enabled. Current items include:
Peak. The peak value of each sweep (in dB).
C/I. Displays each transmitter’s C/I (in dB). The carrier power, C, is for a particular enabled transmitter. The interference, I, is the summation of all other enabled transmitters. When ReceiverView is checked, the powers are before the receiver electronics and thus will include spatial aspects, propagation effects, Doppler, antenna gain, and polarization. When ReceiverView is not checked, the powers are at the output of the transmitter’s antenna and will not account for spatial aspects.
Mode Menu
Selects the display mode. Options currently include:
Power Spectral Density. Displays Power Spectral Densities. See Power Spectral Density Mode for more details.
Spectral Contention . Displays the bands of asset occupancy. See Spectral Contention Mode for more details.
Spectrogram. Displays the power intensity for a region of spectrum over time.
See Spectrogram Mode for more details.
Modes
There are three modes, Power Spectral Density, Spectral Contention, and Spectrogram. The display mode can be found in the Mode menu.
Power Spectral Density Mode
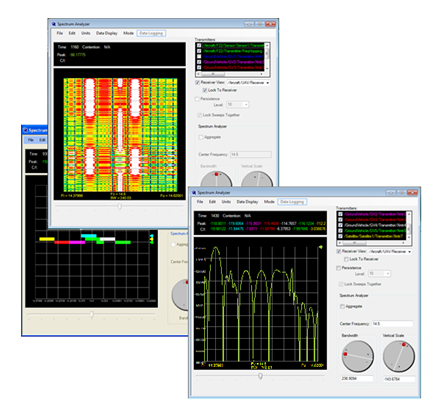
Displays the Power Spectral Density sweeps at each time step (in dBW). The displayed sweeps can represent the Power Spectral Density that is being transmitted into the channel or it can represent the Power Spectral Density that the receiver will see at the input to the receiver back-end electronics. The former is obtained when the Receiver View is not checked. In this case, the power is in the direction of maximum gain, which will be independent of link direction. The latter case is obtained when the Receiver View is checked and will include link direction, propagation effects, Doppler, and receiver front-end effects (antenna pointing, polarization, etc.). In this case, it is as if the Spectrum Analyzer was sitting at the receiver’s location.
The Power Spectral Density mode also enables the Aggregate feature as well as the Persistence feature.
STK computes all Power Spectral Densities out to +-15 with a frequency step size a function of the bandwidth. To increase performance, you can reduce the number of nulls to generate.
When in Power Spectral Density Mode and the mouse is moved over the Sweep Display panel, yellow Cursor Display Lines will display the x and y values associated with the position of the mouse cursor. This can be disabled from within the Edit Menu->Properties…
Spectral Contention Mode
Displays each sweep as a flat bar defined over its band of occupancy. In this mode, it is easy to visualize when assets will have overlapping frequencies, either by design or due to Doppler frequency shifts. When objects don’t overlap, all occupied bands will appear on the same row. When assets drift into another asset’s frequency band, the lines will be drawn above one another across their occupied frequencies. When assets overlap in frequency, the Contention data item in the Data Display will switch to red and display YES. When in this mode if the Peak and C/I data elements are enabled, they will report N/A (No Association).
This mode is particularly useful when the Transmitter Object’s Use Signal PSD is not checked.
Spectrogram Mode
Displays the power intensity at each frequency over time. The x-axis is frequency, the y-axis is time, and the color represents the power intensity. The data will scroll up and off the display so oldest data is at the top of the display. At each time step, the power of all the assets at each frequency is mapped to a color such that each consecutive time is independent of the previous time.
The intensity color map is currently fixed. It utilizes the full spectrum from white to black and is show below.

White represents the most intense power value and black the least. The actual values are relative to the maximum. The maximum value at each time step will be displayed in the Data Display panel.
Application of the Spectrum Analyzer
Use Case 1
Several different types of Blue Force radios are in the field. Red Force radios are known to be in the area and the types of Red Force radios are known. The Blue Force team will be jamming the Red Force radios, but will the Blue Force radios be jammed, too? Can the Blue Force radios, which are being jammed, be configured to use portions of the radio which will not be affected by their jammer?

In this case we have two Blue Force radios and three Red Force radio types. Each red line in the Spectral Contention display represents a Red Force radio. Each blue line represents a Blue Force radio. So, we can see that one of the Red Force radios can be jammed without any impact to Blue Force (far right Spectral Contention line). But, if the other two Red Force radios are going to be jammed some of the Blue Force radio spectrum will be affected. We can also see which portions of the Blue Force spectrum will be affeted. Thus, if the radios can be configured to use the portions of the spectrum which won’t be affected, the Blue Force will not be affected.
Use Case 2
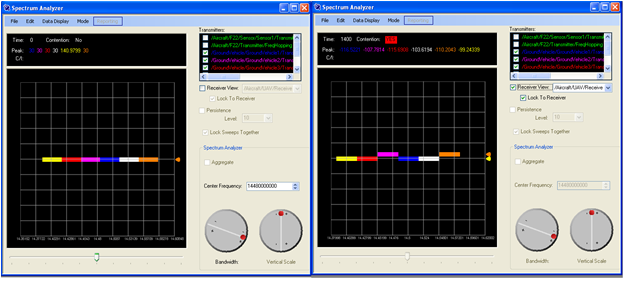
The above Use Case was only necessary to see which radios would interfere with others without consideration of geographical positions—it was just a hardware look at the spectrum use. It did not consider the signals at a particular location on the ground (i.e., at a receiver). To consider what a receiver would see, one would use the Receiver View feature.

This use case considers the impact at a particular receiver. From the first figure below, one can see that the hardware is configured such that each asset will not overlap in frequency. But, due to the motion of the platforms, during animation there are moments when Doppler shift will cause interference among the assets.
Use Case 3
When a Link Budget is performed between the transmitter and receiver, the values are very poor from what is expected. What is going on with the scenario?
Use Case 4
It is desired to see the effects of changing various properties of a transmitter.
Troubleshooting
Q: How do I start the Spectrum Analyzer?
A: See Toolbar.
Q: If I have receivers in my scenario, why are the Receiver View GUI controls still grayed out?
A: Both the Receiver’s Frequency Auto-Tracking and Bandwidth Auto-Scaling must not be checked.
Q: If I have transmitters in the scenario why don’t I see anything in the Spectrum Analyzer?
A: Make sure you have the Spectrum Analyzer’s Center Frequency set to the transmitter’s frequency. If you have Receiver View enabled, check to ensure you have Lock To Receiver checked, and then verify that you have access at the correct time step.
Q: I’m in PSD Mode but my PSD’s are flat?
A: In the Transmitter Object’s property page make sure that the “Use Signal PSD” check box is checked.
Q: How can I increase performance when viewing many PSDs?
A: STK computes the PSD out to +-15 nulls, often times, over sampling. The number of samples will vary as a function of bandwidth. If you are using the Spectrum Analyzer from before STK 10.0, the only way to reduce the number of PSD samples would be to reduce the data rate (which in turn will reduce the bandwidth). Starting in STK 10.0, there is a user control on the Transmitter’s modulator tab that enables you to define how many nulls are generated. Perhaps a future version will allow the frequency step size to be a user-adjustable control, too.