STK Pro, STK Premium (Air), STK Premium (Space), or STK Enterprise
You can obtain the necessary licenses for this tutorial by contacting AGI Support at support@agi.com or 1-800-924-7244.
The results of the tutorial may vary depending on the user settings and data enabled (online operations, terrain server, dynamic Earth data, etc.). It is acceptable to have different results.
Capabilities covered
This lesson covers the following capabilities of the Ansys Systems Tool Kit® (STK®) digital mission engineering software:
- STK Pro
- Analysis Workbench
Problem statement
Engineers and operators need to be mindful of the power generation capabilities of the Global Positioning System (GPS) satellites for which they are responsible. GPS satellites operate in semi-synchronous, medium Earth orbits; due to the length of time a GPS satellite spends passing through Earth's shadow, careful planning is needed for when it enters such an eclipse season, as it may not receive enough Sun exposure on its solar panels to power all its on-board systems. The angle between a satellite's orbital plane and the Earth Sun vector, or beta angle, indicates when a given satellite is entering, or leaving, an eclipse season. You want to analyze a GPS satellite's orbital plane over the course of the forthcoming year to determine when its beta angle will be less than five degrees and the satellite will be in eclipse.
Solution
Use the STK software's Analysis Workbench capability's Vector Geometry tool to model the beta angle for a GPS satellite’s orbital plane over a one-year period. Then, use the Calculation tool to define a conditional beta angle calculation to generate a custom report on the satellite's periods of eclipse.
What you will learn
Upon completion of this tutorial, you will understand the following:
- How to use the Analysis Workbench capability
- How to use the Vector Geometry tool to create custom geometric components
- How to use the Calculation tool to create a custom report with time-varying computational results
Creating a new scenario
First, you must create a new STK scenario, then build from there.
- Launch the STK application (
 ).
). - Click
 Create a Scenario in the Welcome to STK dialog box.
 - Enter the following in the STK: New Scenario Wizard:
- Click when you finish.
- Click Save (
 ) when the scenario loads. The STK application automatically creates a folder with the same name as your scenario for you.
 - Verify the scenario name and location in the Save As dialog box.
- Click .
| Option | Value |
|---|---|
| Name | GPS_Eclipse |
| Start | Today |
| Stop | + 1 year |
Save (![]() ) often during this lesson!
) often during this lesson!
Inserting a GPS satellite
Insert a GPS satellite from the Standard Object Database.
Inserting satellites from the Standard Object Database
Use the Standard Object Database to find an appropriate GPS satellite.
- Go to the Insert STK Objects (
 ) tool.
 - Select Satellite (
 ) in the Select An Object To Be Inserted list.
 - Select From Standard Object Database (
 ) in the Select a Method list.
 - Click .
Limiting your search to GPS satellites
You want to limit your search to just to GPS satellites.
- Enter GPS in the Name or ID field when the Search Standard Object Data dialog box opens.
- Click .
- In the Results list, click on the Space Surveillance Catalog Number column header.
- Click on the Space Surveillance Catalog Number column header again, so that the arrow points downward.
- Select the first satellite in the list whose Official Name and/or Common Name is NAVSTAR.
- Click .
You should see an upward-facing arrow.

Up arrow
If you are using only the Local data source, click on the SSC Number column header.
This will sort the list so that the newest satellites are now at the top.
NAVSTAR satellites form the GPS constellation. The specific GPS satellite you select for this tutorial is immaterial, as long as it's planned to still be in orbit in a year's time.
If you don't have an Internet connection, pick the first satellite, but make sure your local install is using the most recent Two Line Element (TLE) sets that are available. For information on how to obtain the most current TLE files, refer to the
Previewing the satellite's TLE source
The Simplified General Perturbations (SGP4) propagator is used with two-line mean element sets. It considers secular and periodic variations due to Earth being oblate, as well as solar and lunar gravitational effects, gravitational resonance effects, and orbital decay using a drag model.
- Right-click on the Satellite () object in the Object Browser.
- Select Properties (
 ) in the shortcut menu.
 - Select the Basic - Orbit page when the Properties Browser opens.
- Click in the TLE Source panel.
- Review the information when the TLE Preview dialog box opens.
- Click to close the TLE Preview dialog box.
- Click to close the Properties Browser without making any changes.
The STK application queries the AGI Server to find the appropriate set of TLEs during the propagation interval for the specified SSC. Which TLEs are selected, and how they are used, is determined by the parameters in the Setup panel.
Generating an Eclipse Times report
An
- Right-click on your Satellite () in the Object Browser.
- Select Report & Graph Manager... (
 ) in the shortcut menu.
 - Select Eclipse Times (
 ), located in the Installed Styles (
 ) folder, in the Styles list when the Report & Graph Manager opens.
 - Click .
- Scroll through the report.
- Close the Eclipse Times report.
This report provides a wealth of information. However, you are interested only in those eclipse times based on the specific angle drawn between an orbital plane and the Earth Sun vector.
Generating a Beta Angle report
A beta angle of five degrees or less can be considered an eclipse period. In the preinstalled
- Select Beta Angle (), located in the Installed Styles () folder, in the Styles list.
- Click .
- Read the prompt when the Question dialog box opens.
- Click to close the Question dialog box without creating the report.
- Close the Report & Graph Manager.
Due to the length of the analysis period, generating this report can take a long time, and the STK application will display a warning explaining this. Therefore, only generate the report if you want to so.
If you were to generate the report, you'd find that it reports the value of the beta angle each minute by default. While helpful, it does not help you identify the specific periods of eclipse without processing the data further outside of the STK application. However, you can use the Analysis Workbench capability's tools to generate a custom report showing exactly the data you need.
Displaying the Earth Sun vector in the 3D Graphics window
You first need to add the Earth Sun vector and the orbital plane for the GPS satellite to this scenario in order to visualize the beta angle. The Earth Sun vector is predefined. Since the Earth Sun vector displays originating from the Earth, you will add this vector by updating the 3D Graphics window's
- Bring the 3D Graphics window to the front.
- Click Properties () in the 3D Window Defaults toolbar.
- Select the Vector page when the Properties Browser opens.
- Select the Vectors tab.
- Select the Earth Sun Vector - Show check box.
- Select the Show Label check box.
- Enter 4.0 in the Component Size - Scale field in the Common Options panel.
- Click to confirm your changes and to close the Properties Browser.
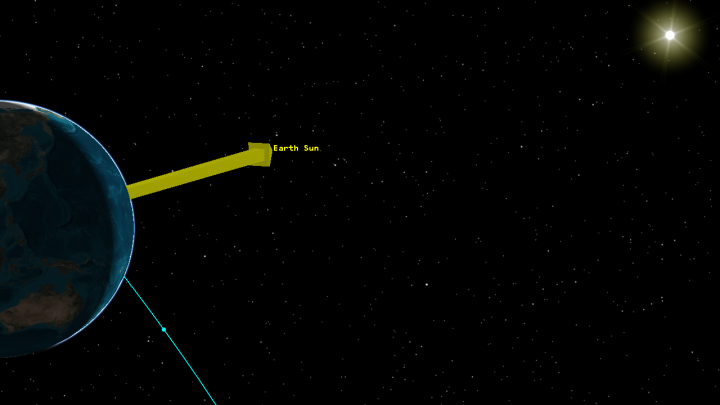
Earth Sun Vector
Creating the GPS satellite's orbital plane
You can create the orbital plane for the GPS satellite using the Vector Geometry tool inside the Analysis Workbench.
Opening the Analysis Workbench
You want the plane that you are going to create to be a child of the Earth rather than the satellite. Having Earth as its parent object allows you to duplicate and modify the orbital plane in the future to represent other orbital planes in the GPS constellation, should you need to do so.
- Click Analysis Workbench... (
 ) in the STK Tools toolbar.
 - Select the Vector Geometry tab when Analysis Workbench opens.
Adding a Vector Geometry component
The orbital plane is defined as the plane perpendicular to (or "normal to") the satellite’s orbital angular momentum; therefore, you can create a Normal type plane. In order to properly construct this plane, you need to define two vectors and a reference point.
- Open the Filter by drop-down list
- Select Primary Central Bodies.
- Select Earth (
 ) in the object tree.
 - Click Create new Plane (
 ) in the Vector Geometry toolbar.
 - Click Type: when the Add Geometry Component dialog box opens.
- Select Normal () in the Select Component Type list when the Select Component Type dialog box opens.
- Click to confirm your selection and to close the Select Component Type dialog box.
- Enter Orbital_Plane in the Name field.
Selecting the orbit normal vector
The orbit normal vector is a unit vector perpendicular to the plane of an elliptical orbit created from the motion of the specified point with respect to the center of the specified central body. At any time, the orbit is fit to the current motion of the specified point according to the specified type of orbital elements. The unit vector is directed along the current orbit angular momentum of the specified point with respect to the specified central body.
- Click the Normal Vector ellipsis (
 ).
). - Select the Satellite () object in the object tree when the Select Reference Vector dialog box opens.
- Select Orbit_Normal (
 ), located in the Installed Components () folder, in the Vectors for: [Satellite] list.
 - Click to confirm your selection and to close the Select Reference Vector dialog box.
Selecting the reference vector
The reference vector determines where the axes of the plane are positioned, and sets up how the x and y axes of the plane are oriented. Align the x axis with the satellite’s ascending node.
- Click the Reference Vector ellipsis ().
- Select the Satellite () object in the object tree when the Select Reference Vector dialog box opens.
- Select LineOfNodes (), located in the Installed Components () folder, in the Vectors for: [Satellite] list.
- Click to confirm your selection and to close the Select Reference Vector dialog box.
- Leave Earth Center as the plane's reference point, since the satellite's orbital plane will pass through the Earth.
- Click to confirm your selections and close the Add Geometry Component dialog box.
- Leave the Analysis Workbench open.
Displaying the orbital plane in the 3D Graphics window
You can display the satellite's orbital plane in the 3D Graphics window.
- Bring the 3D Graphics window to the front.
- Click Properties () in the 3D Window Defaults toolbar.
- Select the Vector page when the Properties Browser opens.
- Select the Planes tab.
- Click .
- Select Earth () in the object tree when the Add Components dialog box opens.
- Select Orbital_Plane (), located in the My Components () folder, in the Components for: Earth list.
- Click to confirm your selection and to close the Add Components dialog box.
- Select the Translucent plane check box.
- Click to confirm your changes and to keep the Properties Browser open.
Displaying the line of nodes vector in the 3D Graphics window
You used the line of nodes vector as the reference axis for the plane you created. It should line up along the x axis of the orbital plane when selected for display.
- Select the Vectors tab.
- Click .
- Select the Satellite () object in the object tree when the Add Components dialog box opens.
- Select LineOfNodes (
 ), located in the Installed Components () folder, in the Components for [Satellite] list.
 - Click to confirm your selection and to close the Add Components dialog box.
- Click to confirm your changes and to close the Properties Browser.
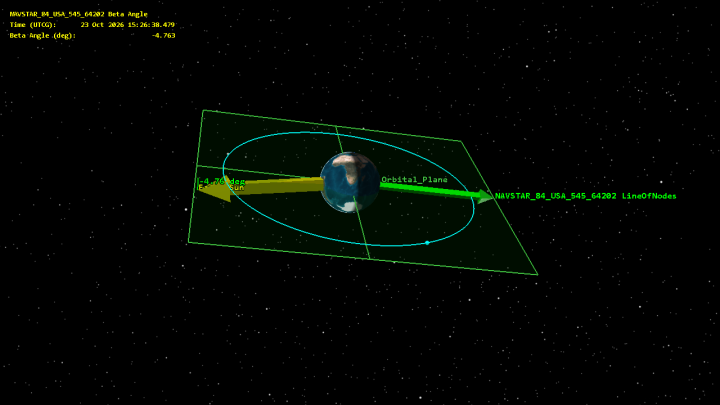
- Bring the 3D Graphics window to the front to view the orbital plane, Earth Sun vector, and line of nodes vector.
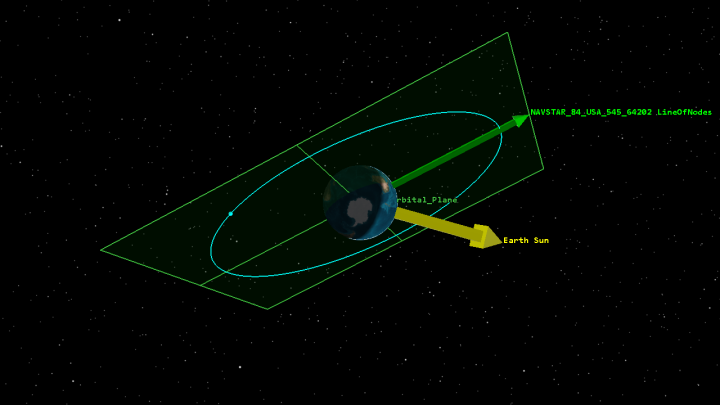
Orbital Plane and Line Of Nodes
Defining the beta angle
For the purposes of this tutorial, the beta angle is defined as the angle between the orbital plane of the satellite and the vector to the sun. The beta angle is the smaller angle (there are two angles) between the Earth Sun vector and the plane of the satellite's orbit. Create the beta angle using the Vector Geometry tool.
Creating a new To Plane angle
A To Plane angle defines an angle between a vector and a plane.
- Return to the Analysis Workbench.
- Ensure the Vector Geometry tab is selected.
- Select Earth () in the object tree.
- Click Create new Angle (
 ) in the Vector Geometry toolbar.
 - Click Type: when the Add Geometry Component dialog box opens.
- Select To Plane () in the Select Component Type list when the Select Component Type dialog box opens.
- Click to confirm your selection and to close the Select Component Type dialog box.
- Enter Beta_Angle in the Name field.
Selecting the reference vector
Select the reference vector for the angle — in this case, the Earth Sun vector.
- Click the Reference Vector ellipsis ().
- Select Earth () in the object tree when the Select Reference Vector dialog box opens.
- Select Sun (), located in the Installed Components () folder, in the Vectors for: Earth list.
- Click to confirm your selection and to close the Select Reference Vector dialog box.
Selecting the reference plane
Select the GPS satellite's orbital plane as the reference plane for the angle.
- Click the Reference Plane ellipsis ().
- Select Earth () in the object tree when the Select Reference Plane dialog box opens.
- Select Orbital_Plane (
 ), located in the My Components () folder, in the Planes for: Earth list.
 - Click to confirm your selection and to close the Select Reference Plane dialog box.
Selecting the signed option
The To Plane angle can be computed using signed or unsigned options. If Signed is selected, the angle can be measured as either positive or negative when the reference vector is directed toward the plane’s normal. Otherwise, the angle is measured as positive regardless of on which side of the plane the reference vector is located.
- Select the Signed check box.
- Ensure Positive is selected in the Toward plane normal drop-down list.
- Click to confirm your selections and to close the Add Geometry Component dialog box.
Displaying the beta angle in the 3D Graphics window
You can display the beta angle in the 3D Graphics window.
Adding a new angle
Add a new angle for visualization by updating the 3D Graphics window's properties.
- Bring the 3D Graphics window to the front.
- Click Properties () in the 3D Window Defaults toolbar.
- Select the Vector page when the Properties Browser opens.
- Select the Angles tab.
- Click .
Selecting the beta angle
Select the beta angle you created to visualize it in the 3D Graphics window.
- Select Earth () in the object tree when the Add Components dialog box opens.
- Select Beta_Angle (), located in the My Components () folder, in the Components for: Earth list.
- Click to confirm your selection and close the Add Components dialog box.
- Clear the Show label check box.
- Ensure the Show angle value check box is selected.
- Click to confirm your changes and to close the Properties Browser.
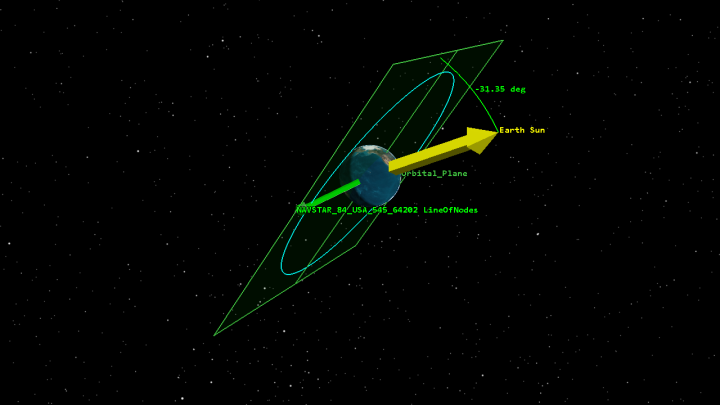
Beta Angle
Animating the scenario
Animate your scenario to visualize the change in your beta angle.
- Click Increase Time Step (
 ) in the Animation toolbar and set the Time Step to 7200.00 sec.
 - Click Start (
 ) to animate the scenario.
 - Click Reset (
 ) when you are finished.
You can see the angle change over the one-year analysis period.
Using the Calculation tool to define a beta angle calculation
To determine your eclipse periods, you want to know the periods when the beta angle is between -5 degrees and 5 degrees. This can be accomplished quickly using the Calculation tool. You can use the Calculation tool to combine system data with algebraic, functional, and calculus operations to extend models and define new data providers with custom algorithms from 20 mathematical operations.
Creating a new scalar calculation
Scalars define components that produce scalar time-varying calculations.
- Return to the Analysis Workbench.
- Select the Calculation tab.
- Select Earth () in the object tree.
- Click Create new Scalar Calculation (
 ) in the Calculation toolbar.
Defining and Angle calculation
An Angle scalar calculation returns the angular displacement specified by an Angle component from the Vector Geometry tool.
- Leave Angle as the selected Type when the Add Calculation Component dialog box opens.
- Enter Beta_Angle_Angle in the Name field.
- Click the Input Angle ellipsis ().
- Select Earth () in the object tree when the Select Reference Angle dialog box opens.
- Select Beta_Angle (
 ), located in the My Components () folder, in the Angles for: Earth list.
 - Click to confirm your selection and to close the Select Reference Angle dialog box.
- Click to confirm your selection and to close the Add Calculation Component dialog box.
Creating a new calculation condition
Conditions define a scalar calculation, which is considered to be satisfied when it is positive and not satisfied when it is negative.
- Ensure Earth () is selected in the object tree.
- Click Create new Condition (
 ) in the Calculation toolbar.
 - Leave Scalar Bounds selected for the Type when the Add Calculation Component dialog box opens.
- Enter Eclipse_Season in the Name field.
- Click the Scalar ellipsis ().
- Select Earth () in the object tree when the Select Reference Scalar Calculation dialog box opens.
- Select Beta_Angle_Angle (
 ) in the Scalar Calculations for: Earth list.
 - Click to confirm your selection and to close the Select Reference Scalar Calculation dialog box.
The Scalar Bounds condition type defines a condition by combining a specified Scalar component with scalar bounds.
Setting the satisfaction criteria
You want your condition to be satisfied when the beta angle is less than five degrees in either direction from the orbital plane.
- Open the Operation drop-down list.
- Select Between Minimum and Maximum.
- Enter - 5 deg in the Minimum field.
- Enter 5 deg in the Maximum field.
- Click to confirm your selections and to close the Add Calculation Component dialog box.
Creating an Eclipse Season Satisfaction Intervals report
Generate a report that tells you the exact dates and times, during the one-year test period, when your GPS satellite will enter and exit the eclipse seasons, based on the conditions set for the beta angle.
Creating a Satisfaction Intervals report
You can find the eclipse season by reporting on the satisfaction intervals for the Eclipse Season condition.
- Expand (
 ) Eclipse_Season (), located in the My Components () folder, in the Components for: Earth list.
 - Right-click on SatisfactionIntervals (
 ).
). - Select Report... in the shortcut menu.
Setting the report's units of measure
You want to set the
- Click Report Units (
 ) in the toolbar when the Eclipse Season Satisfaction Intervals report opens.
 - Select the Time Dimension in the Units: Eclipse_Season.SatisfactionIntervals dialog box.
- Select Days (day) in the New Unit Value list.
- Select the Set as Default check box.
- Click to confirm your selection sand to close the Units: Eclipse_Season.SatisfactionIntervals dialog box.
- Click Save as quick report (
 ) in the report's menu.
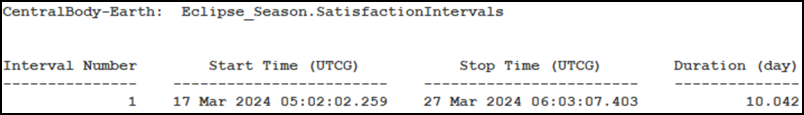
Eclipse Season Report
By saving the report as a quick report, you can open it up any time in the future from the Quick Report Manager, rather than having to open the Analysis Workbench each time.
Viewing the start of the eclipse season
You can use the Eclipse Season Satisfaction Intervals report to jump to the beginning of one of the satellite's eclipse seasons.
- Right-click on the Start Time of one of the eclipse periods in the report.
- Select Start Time in the shortcut menu.
- Select Set Animation Time in the Start Time submenu.
- Close the Eclipse Season Satisfaction Intervals report.
- Bring the 3D Graphics window to the front to view the beginning of the eclipse season.
Adding a dynamic data display
You can update the 3D Graphics window's
- Open the Satellite () object's Properties ().
- Select the 3D Graphics - Data Display page when the Properties Browser opens.
- Click .
- Select Beta Angle in the Styles list when the Add a Data Display dialog box opens.
- Click to confirm your selection and to close the Add a Data Display dialog box.
- Select the Show check box for Beta Angle.
- Click to confirm your changes and to close the Properties Browser.
Beta Angle and Data Display
You now have a display of the beta angle in the 3D Graphics window. This makes good use of the STK application to build a briefing on the satellite that requires both analysis and graphics.
Animating the scenario
You can visualize the dynamic beta angle display.
- Click Start () in the Animation toolbar to animate your scenario.
- Note how the beta angle changes as the scenario progresses.
- Click Reset () when you are finished.
Saving your work
Save your work and close out of your scenario.
- Close any open reports, tools, and properties.
- Save () your work.
Summary
The purpose of this tutorial focused on determining a GPS satellite eclipse season during a one-year analysis period. You began by inserting a selected GPS satellite. Then you displayed the Earth Sun vector in the 3D Graphics window. You opened the Analysis Workbench and selected the Vector Geometry tool. You built a Normal orbital plane using the satellite's normal vector and its line of nodes reference vector. You displayed the orbital plane and the line of nodes in the 3D Graphics window. You created a beta angle between the Earth Sun vector and the satellite's orbital plane and visualized the beta angle in the 3D Graphics window. You switched to the Calculation tool. You created a scalar calculation using the beta angle and created a condition that focused on the beta angle when it fell between -5 and 5 degrees. You created a report that showed when the eclipse season would begin and end during your one-year analysis period based on the condition. Finally, you displayed the beta angle data in your 3D Graphics window.
On your own
Because you set your scenario time to Today, the data will change each time you reopen your scenario. Try saving your Eclipse Season Satisfaction Intervals report externally to see how it changes over time as your approach the satellite's eclipse season. If you have a 3D model of your satellite that has the solar panels registered, you can calculate the power generation using the STK software's SatPro capability and the Solar Panel tool. See the Measuring Power Generation of Solar Panels on a Satellite tutorial for more information.