STK Premium (Space) or STK Enterprise
You can obtain the necessary licenses for this tutorial by contacting AGI Support at support@agi.com or 1-800-924-7244.
The results of the tutorial may vary depending on the user settings and data enabled (online operations, terrain server, dynamic Earth data, etc.). It is acceptable to have different results.
Capabilities Covered
This lesson covers the following STK Capabilities:
- STK Pro
- Space Environment and Effects Tool (SEET)
Problem Statement
Satellite designers and mission planners need to be able to quantify the amount of exposure to high levels of ionizing radiation over the course of satellite missions. The data can be used to minimize exposure and to design adequate shielding in order to prevent single event upsets and failures of sensitive instrumentation. The SAA (South Atlantic Anomaly) feature of STK's Space Environment and Effects Tool (SEET) capability supports this need by computing entry and exit times and duration of exposure to selectable levels of ionizing radiation emanating from the South Atlantic Anomaly.
Break It Down
The following information should be determined before developing a Vehicle Temperature model scenario using STK:
- Note the altitudes covered by the SAA database range from 400-1700 kilometers. Orbits outside this range will have limited exposure to ionizing radiation originating from the South Atlantic Anomaly.
- You will design an orbit with a semi-major axis of 7000 km.
- You will do a historical study from Jul 1 2016 - Jul 2 2016.
- Select one of four proton energy channels to be analyzed (23, 38, 66, or 94 MeV), based on the nature and sensitivity of on-board instrumentation and anticipated duration of exposure.
Solution
For a given vehicle configuration and orbit, use SEET to determine the amount of exposure to high levels of ionizing proton radiation over the course of its mission lifetime due to satellite interaction with the SAA. Generate a report to show this data.
Video Guidance
Watch the following video. Then follow the steps below, which incorporate the systems and missions you work on (sample inputs provided).
Create a Scenario
- Create a new scenario by using the New Scenario Wizard. You can also extend the File menu and select New...
- Rename your scenario SEET_SAA.
- Set the analysis period to the following:
Option Value Analysis Start Time 01 Jul 2016 16:00:00.000 UTCG Analysis End Time 02 Jul 2016 16:00:00.000 UTCG
Add a Satellite
Add a satellite that will traverse the South Atlantic Anomaly region in altitude, as well as, latitude and longitude.
- Insert a new satellite using the following method:
- Click the Insert button.
- Set the following options in the Orbit Wizard.
- Click OK.
- Close the STK Insert Objects tool.
| Option | Value |
|---|---|
| Select an Object to be Inserted: |
|
| Select a Method |
|
| Option | Value |
|---|---|
| Name | SAA_Leo |
| Type | Orbit Designer |
| Semi-major axis | 7000 km |
| Eccentricity | 0.03 |
| Inclination | 75 degrees |
| Argument of Perigee | 0.0 |
| RAAN | 100 deg |
| True Anomaly | 0.0 |
Set the South Atlantic Anomaly
- Open SAA_Leo's (
 ) properties (
 ).
). - Select the Basic - SEET Environment page.
- Locate the South Atlantic Anomaly panel.
- Leave the default setting of >23MeV.
- Set the Flux Level to Tenth of Peak.
- Click Apply.
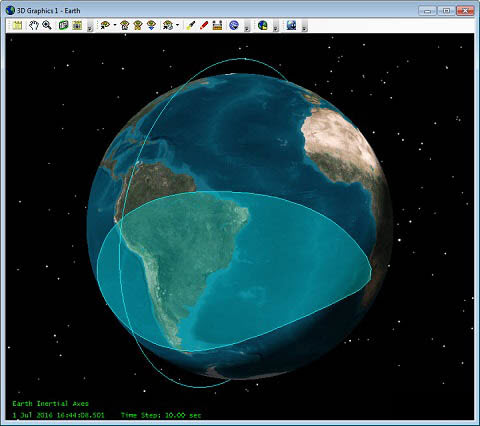
View the SAA Flux Contours at a Selectable Altitude
- Select the 2D Graphics - SEET Environment.
- Enable the Show 2D and Show 3D options in the South Atlantic Anomaly Contour field.
- Enable the Fill option.
- Enable the Show At Vehicle Altitude option.
- Click OK.
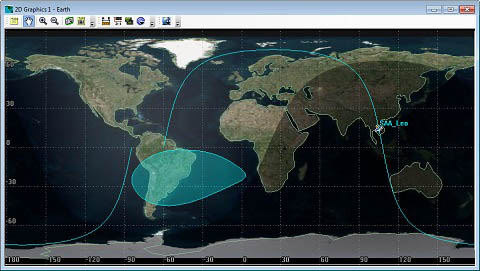
Animate the Scenario
- Play (
 ) the scenario. You will see the satellite crossing the SAA. You will also notice that the contours change with the satellite altitude.
 - Reset (
 ) the scenario when you are finished.
Create a Report Detailing SAA-induced Ionizing Radiation Exposure
- Open the Report & Graph Manager (
 ).
). - Click the New Report (
 ) button.
 - Enter a name for the report like SAA_IonRadiation.
- Double-click the SEET SAA Crossing Times Data Provider. This will move all of those contents to Report Contents field of the report.
- Click OK.
- Generate the SAA_IonRadiation report.
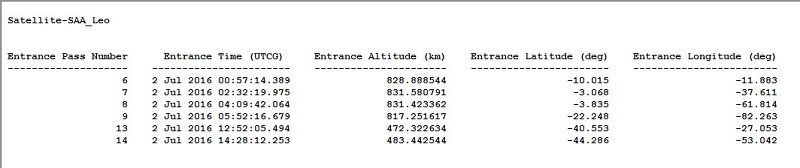
Report and Analysis
A report window will be displayed containing the data selected for the report. Examine the report to determine the amount of exposure to proton radiation over the time interval of interest.