Telemetry Interface
Use the Telemetry Management page to select the SOLIS telemetry parameters to be available for analysis after a run. Analyze this data directly with the Report & Graph Manager or directly export the data to CSV for analysis using another tool, or both.
- Selecting a Telemetry Output Destination
- Selecting Telemetry Packets
- Available Telemetry Coloring
- Interfacing Telemetry with an External Ground Data System (GDS)
- Performance Effects of Telemetry

Selecting a Telemetry Output Destination
At the top of the Telemetry Interface tab, you can choose to send telemetry to the STK Data Provider, CSV Files, or both.

STK Data Provider
Selecting the STK Data Provider as the output destination enables you to generate real-time graphs and reports. All data will appear in the STK Report & Graph Manager under User Supplied Data.
CSV files
Selecting CSV files as the output destination will place telemetry data directly into CSV files. All data will be placed in the specified directory under a subfolder labeled with the date and time of simulation execution. There are three options available for CSV file format:
- One File per Distinct Sample Period places all data of a specified sample period in the same file. When choosing the same sample period for all packets, this format provides an easy-to-use tabular file containing all the data.
- One File per Packet places each packet in its own CSV file. All files exist at the same layer in the directory structure.
- One File per Packet (Directory Tree) places each packet in its own CSV file. The files will be generated in a directory tree that replicates the telemetry hierarchy.

Selecting telemetry packets
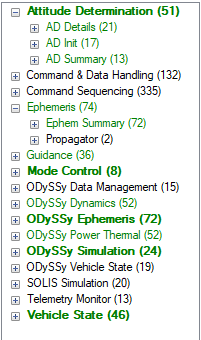
The list of available telemetry for reporting and plotting will grow as you add new SOLIS components (e.g., adding a reaction wheel when the Attitude Control System is set to PID control). There are three levels of available telemetry:
- Telemetry Groups
- Packets
- Channels (which are italicized for easier identification)
On the right side of the Telemetry Interface page is a list of selected telemetry packets with the sample period for each telemetry packet.
Select the telemetry group, packet, or channel to view information about it, displayed on the upper-right side of the page.
Modifying selected telemetry list
- To add a packet, select either the group containing that packet, the packet itself, or a channel in that packet and click . This changes to "Add Packet Group," "Add Packet," or "Add Parent Packet," depending on the level selected.
- To add two or more packets at once, use ctrl-A to add all and shift-click or ctrl-click to select the packets. The button changes to "Add All" or "Add Selected", respectively.
- To remove an item, select it and click either or .
- To change sample periods, type in a new sample period and click either or .
- To change the order of the Selected Telemetry, click either or .

Available telemetry coloring
The items in the available telemetry list change in appearance as packets are selected and deselected:
| Telemetry Color | Description |
|---|---|
| Black, Not Bold | Not selected |
| Green, Not Bold | Channel or packet selected or at least one but not all packets in group selected |
| Green, Bold | All packets in group selected |

Interfacing telemetry with an external Ground Data System (GDS)
For details on how to interface SOLIS telemetry with an external GDS package, contact us through the [Service Desk](https://max.rocketlabusa.com/support), and we will help you get set up.
Performance effects of telemetry
See the Run Speeds page for more details.