Contour Lines
The Contour Line tool enables you to create color contour lines from external data sources. A contour line colors the aircraft route based on the value of the selected flight data element.
There are two options to create contour lines:
From Metrics Contour Lines
This section outlines the Contour Line window functions upon selecting the From Metric... (![]() ) option from the Flight Analysis Tool (FAT) menu.
) option from the Flight Analysis Tool (FAT) menu.
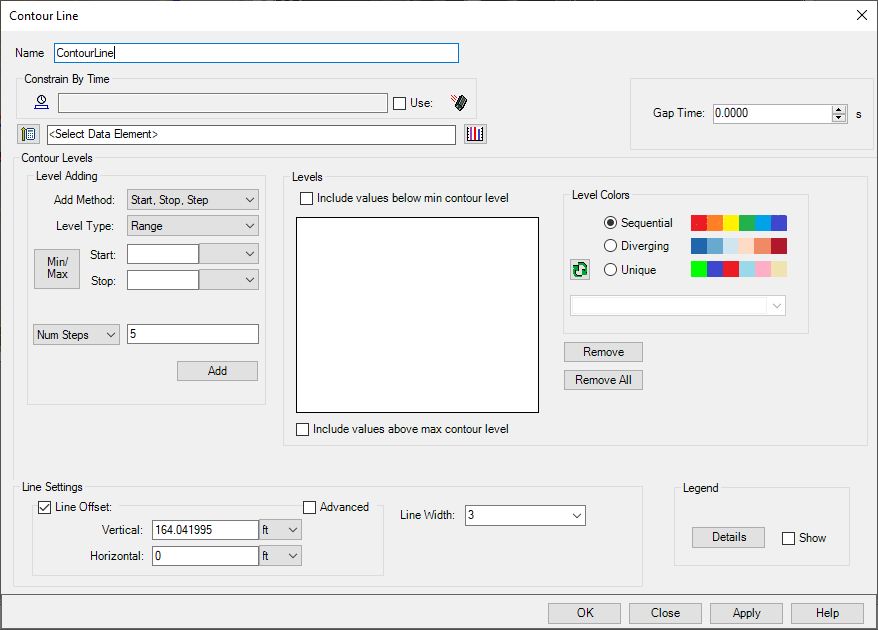
Constrain by Time
The table below details the options available in the Constrain by Time section.
| Option | Description |
|---|---|
| Select Time Interval ( |
Click this button to select a time interval or interval list. |
| Use | Select this check box to use the selected time constraint. Clear this check box to not use the selected time constraint. |
| Clear Time Interval ( |
Click this button to clear the current time component. |
Selecting a Data Element
| Option | Description |
|---|---|
| Select Data Element ( |
Click this button to select data element that will be used to color the contour line. You must select a data element before you can proceed to add contour levels. |
| Graph Preview ( |
Click this button to create a graph of the selected data element to see what values would be reasonable to set. |
Gap Time
The gap time value is the maximum time between data points a contour line will be drawn. If the gap time is set to 0, no gap time is used and a continuous line is drawn between all data points. If the gap time is set to 5 seconds, any span of 5 seconds or more in the data points will not have a contour line. The default value is the current value of the Data Drop-Out preference.
STK Time Step
When an STK Data Element is selected in the Data Element Selector, the STK Time Step option will appear in the dialog. When creating contours from a native STK data element, this affects the contour line fidelity and speed of creation. A higher time step would produce a faster, but less accurate contour line. The default value is 0.1 seconds and the value must be greater than 0.
Contour Levels
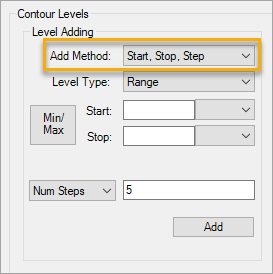
Level Adding Section
From the Add Method drop-down, you can select from six different contour levels.
The table below details the available options in this section.
| Option | Description |
|---|---|
| Above/Below |
Specify a numerical value, select a unit, and click . This creates a contour with an above color, an equal color, a below color, and adds it to the Levels section. By default, this method uses white and red colors. |
| Between |
Specify start and stop values, select their units, and click . This creates a contour with a below color, a between color, above or equal colors, and adds it to the Levels section. By default, this method uses white and red colors. |
| Explicit Value |
Enter integer data one value at a time and click . The specified values will be the color of the original route. Selecting the Include values below min contour level check box or the Include values above the max contour level applies specific colors to those sections of the route. By default, this method uses the Unique preset color palette |
| Explicit Range |
Enter the start and stop values, select their units, and click .. This creates the contour and adds it to the Levels section. You can then add another range and add it to the Levels section. The ranges do not have to be consecutive. Values that are not specified will be the color of the original route. By default, this method uses the Sequential preset color palette. |
| Start, Stop, Step |
From the Level Type drop-down, select either Range or Exact Value.
By default, this method uses the Sequential preset color palette. Clicking the button queries the data and retrieves the minimum and maximum values.
|
| Start, Stop, Center, Step |
From the Level Type drop-down, select either Range or Exact Value.
By default, this method uses the Diverging preset color palette. Clicking the button queries the data and retrieves the minimum and maximum values.
|
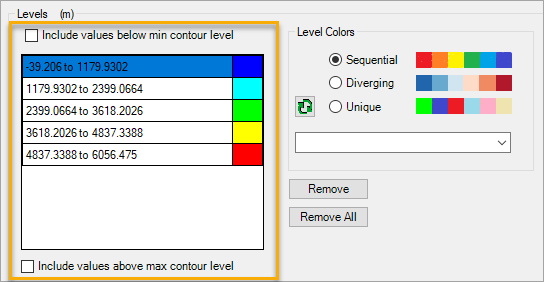
Levels Section
After adding contour levels from the Level Adding section, the contours are created and they display as a list in the Levels section.
The table below details the available options in this section.
| Option | Description |
|---|---|
| Include values below min contour level | When selected, you can define the color that will be used below the start value. |
| Include values above max contour level |
When selected, you can define the color that will be used above the stop value. |
| Remove |
Removes the selected contour from the list. |
| Remove All |
Removes all of the contours from the list. If you wish to change the Level Adding method, you must first remove all contour levels from the Levels section.
|
To change the color of a contour level, simply double-click the color swatch and choose a different color from the palette. To use preset colors, refer to the Level Colors section.
Level Colors Section
The Level Colors section enables you to choose from a set of preset colors for the contour levels:
-
Sequential Colors
-
Diverging Colors
-
Unique Colors
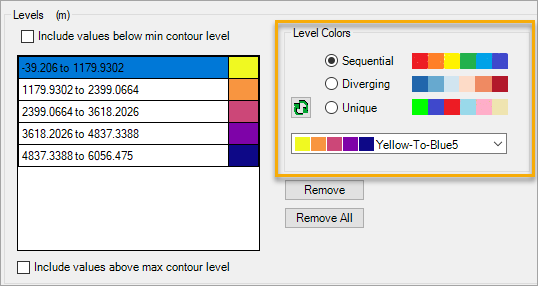
Clicking the ( ) button flips the color order for the contours in the Levels section. You can flip the color palette order for all methods except Above/Below, and Between.
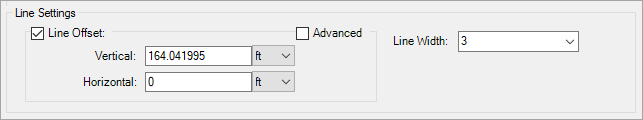
Line Settings
Line Offset Section
You can specify an offset, which indicates that the contour line should be drawn a specified distance and direction off of the actual route in the topocentric frame. This feature helps in visual clarity when multiple contour lines are drawn.
Use the Vertical and Horizontal fields to specify the location of the line offset.
Advanced Line Offset
If you want more control over the line offset, select the Advanced check box. This allows you to select a reference frame (![]() ), then use the X, Y, and Z fields to specify the location of the line offset.
), then use the X, Y, and Z fields to specify the location of the line offset.
Contour Legend
The Legend section enables you define the position and size of the contour legend.
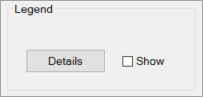
Select to load the Display Contour Legend screen. To display the legend after it is created, select the Show check box.
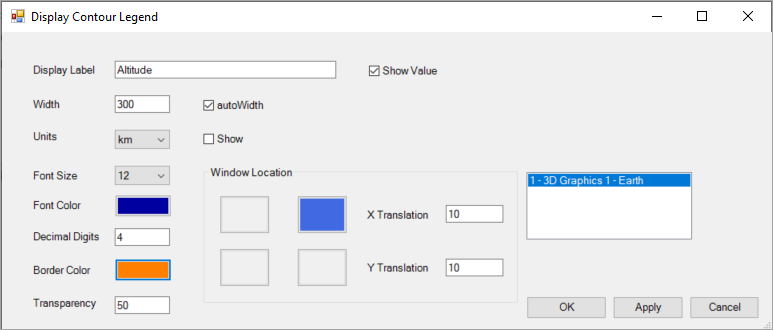
The table below details the options that are available on this screen.
| Option | Description |
|---|---|
| Display Label | The label that describes the chosen data element for the contour. |
| Show Value | The value of the data element, which displays on the same line as the Display Label. The value updates in real time when the scenario is animated. To prevent the value from displaying, clear the check box. |
| Width | The width of the legend measured in pixels. You can enter a value into the field, or you can select the autoWidth check box and TETK will calculate the minimum width. |
| Units | The unit of measure in which the data element and contour levels will be shown. By default, the unit is shown after the Display Label. |
| Font Size | The size of the font for the Display Label and data element values. The default value is 12. |
| Font Color | The color of the font. The Display Label will be in the corresponding contour level color if the value is shown. |
| Decimal Digits | The number of digits to show the contour level values. The default is 4. |
| Border Color | The color of the border around the legend. |
| Transparency | This value defines how transparent the legend background is, with a value of 0 being opaque and a value of 100 being see-through. The default value is 50. |
| Window Location | The location where the legend displays on the graph. The legend can be located in each corner of the 3D window. The default location is upper right. |
| X,Y Translation | The offset distance that the Legend displays from the corner, measured in pixels. |
The field to the right of the Window Location field enables you to define the 3D window that will display the legend.
From Intervals Contour Lines
This section outlines the Contour Line window functions upon selecting the From Intervals... ( ) option.
Available Elements
Use this list of the time intervals to select elements for which to display contour lines by clicking the Add (![]() ) button.
) button.
Note that flight segments already have a color defined, so choosing them as a selected element can be redundant.
Selected Elements
Use this list to assign the colors used for the elements. A color is assigned automatically, but you can change the color by clicking it and selecting a new one.
You can also remove elements from the list by selecting them and clicking the Remove (![]() ) button.
) button.
Line Settings
Line Offset Section
You can specify an offset, which indicates that the contour line should be drawn a specified distance and direction off of the actual route in the topocentric frame. This feature helps in visual clarity when multiple contour lines are drawn.
Use the Vertical and Horizontal fields to specify the location of the line offset.
Advanced Line Offset
If you want more control over the line offset, select the Advanced checkbox. This allows you to select a reference frame (![]() ), then use the X, Y, and Z fields to specify the location of the line offset.
), then use the X, Y, and Z fields to specify the location of the line offset.
Line Width
Select how thick the contour line is. Valid values are 1-10.
Constrain Contour Line by Time
| Option | Description |
|---|---|
| Clear Time Interval ( |
Click this button to clear the current time component. |
| Select Time Interval ( |
Click this button to select a time interval or interval list. |
| Use |
Select this check box to use the time constraint or clear it to not use a time constraint. |