Carpet Plot Tool
A Carpet Plot is a means of displaying data dependent on two variables in a format that makes interpretation easier than normal multiple curve plots. A Carpet Plot can be thought of as a multi-dimensional Parametric Study.
![]()
Launching the Carpet Plot Tool
To access the Carpet Plot Tool, click the Carpet Plot Tool button on the Analyzer toolbar.

Specifying Variables
To perform a Carpet Plot study, you must specify two design variables and a response. For the design variables, you must specify a starting value, ending value, and number of steps. To select variables, drag them from the Component Tree and drop them into the Carpet Plot tool.
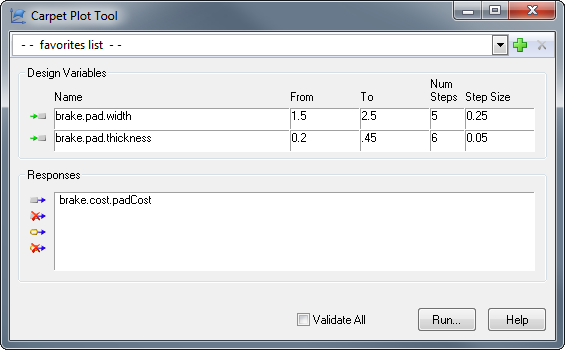
Performing the Study
To perform the study, click the Run... button. This will first build a table of runs. These runs consist of all combinations of the two design variables for their specified ranges and number of steps. After the table has been created, it will run through each case and store values in the Data Explorer.
The total number of runs is the multiplication of the two step values, e.g., specifying step values of 5 and 6 will result in 30 runs.
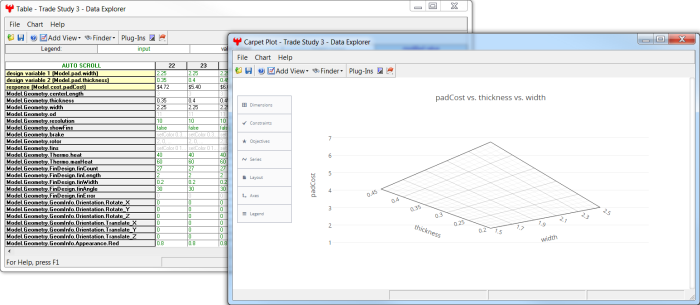
By default, the entire Model is run so that constraints can be correctly computed from the data in the Data Explorer. To run only the components required for the study, clear the Validate All checkbox. A Carpet Plot is automatically created to display the results of the trade study.
See Also: Data Explorer | Parametric Study Tool | | DOE Tool | Probabilistic Analysis Tool