Probabilistic Analysis Tool
The Probabilistic Analysis Tool helps you understand how uncertainties in the design parameters affect the outputs of STK's Analyzer capability. The tool is typically used to compute the probability that the value of an output variable exceeds a specified limit. In addition to random sampling methods such as the Monte Carlo method, the tool provides a number of additional analytical methods that require much smaller sample sizes. Probabilistic analyses can be set up and executed through an unified graphical user interface (GUI). Using the GUI, users can easily switch between available algorithms.
![]()
Launching the Probabilistic Analysis Tool
To access the Probabilistic Analysis Tool, click the Probabilistic Analysis Tool button on the Analyzer toolbar.

Selecting Design Variables
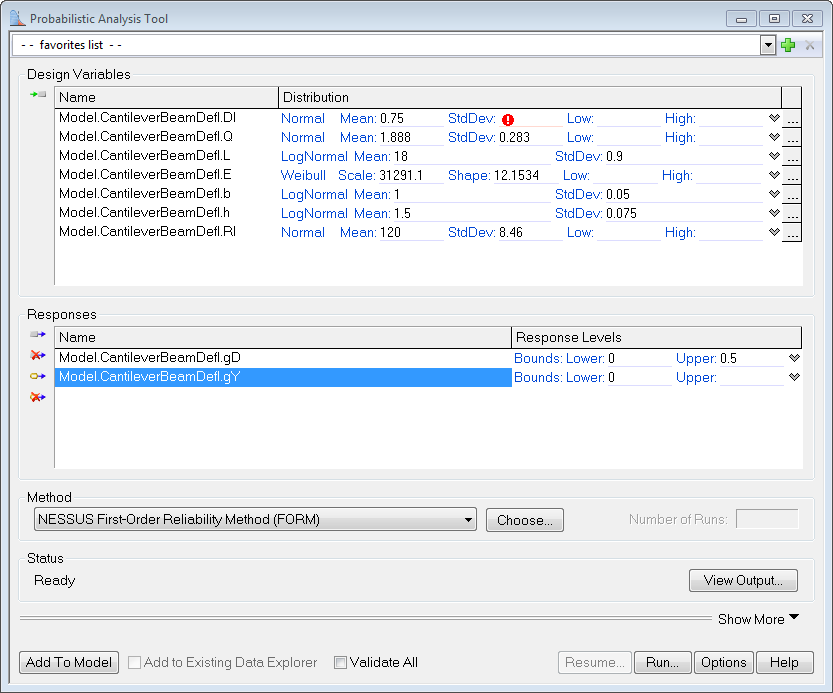
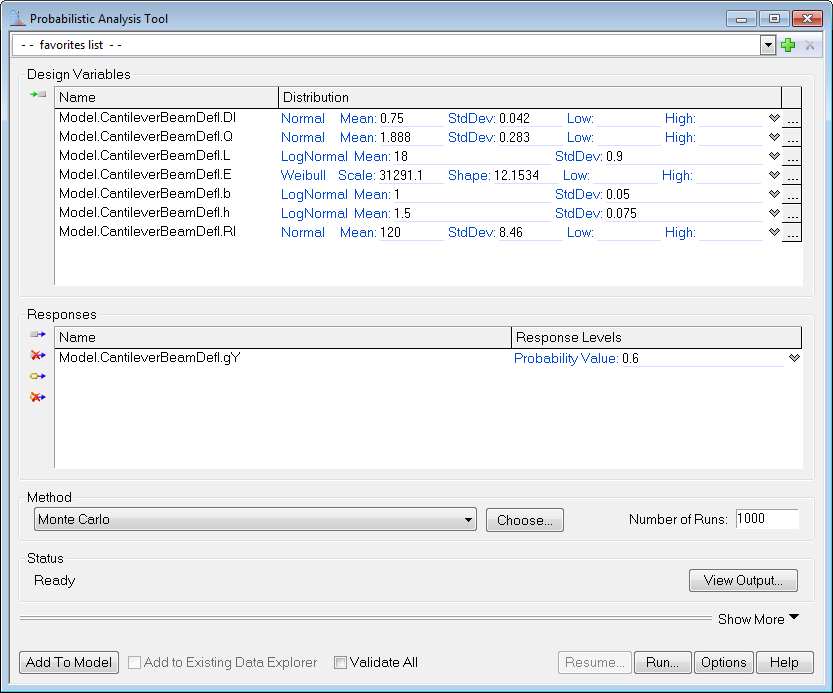
Design variables are inputs to a model and they may have uncertainties associated with them. These uncertainties are usually characterized by probabilistic distribution functions. Response variables are outputs of the model and they are subject to variation caused by uncertainties in the design variables. To select variables in the Probabilistic Analysis Tool, drag variables from the Component Tree and drop them into the Probabilistic Analysis Tool.

Selecting Distributions for Design Variables
It is important to properly specify the distribution characteristics of the design variables. When a new design variable is added to the tool, the Distribution Selection dialog will appear.
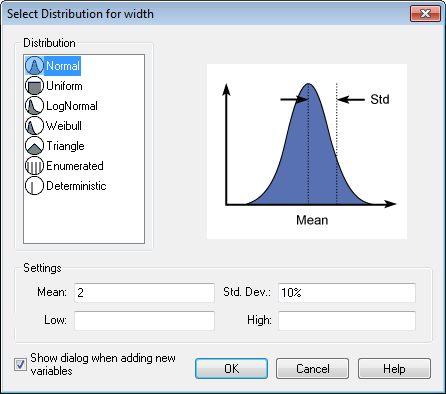
Using the Distribution Selection dialog, users can choose a distribution for a given design variable. It supports the following probabilistic distributions:
- Normal - A "bell-shaped" distribution which describes many situations where observations are distributed symmetrically around the mean. 68% of all values under the curve lie within one standard deviation of the mean and 95% lie within two standard deviations.
-
- Uniform - A "flat" distribution in which all possible solutions between the lower bound and upper bound are equally likely.
-
- Lognormal - A probability distribution in which the log of the random variable follows the normal distribution. The lognormal distribution is commonly used for general reliability analysis, fatigue failures, material strengths and loading variables.
-
- Weibull - A distribution defined by shape and scale parameters. Two special cases of this distribution are: 1) the distribution is an exponential distribution when the shape parameter equals to 1, and 2) the distribution is a Rayleigh distribution when shape parameter equals to 2. This distribution is often used for modeling device failure rate and wind speeds.
-
- Triangle - A triangle shaped distribution that is defined by a center point that is the mean and the population density slants off linearly to the lower bound and upper bound. All the three parameters should be specified to completely define the distribution.
-
- Enumerated - A distribution with a list of discrete values, all of which are equally probable. The discrete values specified should be separated by commas.
-
- Deterministic - If a design variable value is to be fixed, use this distribution.
Mean and Standard Deviation should be specified for all design variables of type Normal and Lognormal otherwise Analyzer will display an error in the Status window. Both Low and High values should be specified for design variables of Uniform distribution as they are required to completely define the distribution. Similarly Scale and Shape are required parameters to completely define a Weibull distribution.
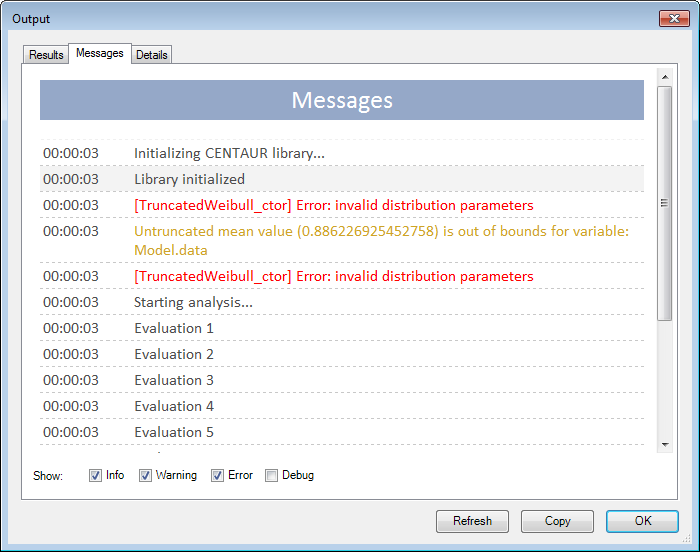
The Low and High values maybe used as bounds if the distribution under consideration is a truncated distribution of type Normal or Weibull. If, for example, some design variable does not have a value beyond a certain limit, this limit value could be used as a bound for the variable. Generally, bounds of this type should not be beyond 6 standard deviations from the mean. The NESSUS methods will display a warning if the bounds specified for the distribution are invalid or if the mean is not within the specified bounds. The results obtained in such cases should be treated with caution.
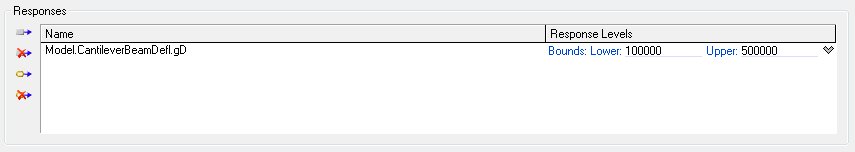
Selecting Response Levels
To select response variables, drag them in from the Component Tree into the response values window of the Probabilistic Analysis Tool.
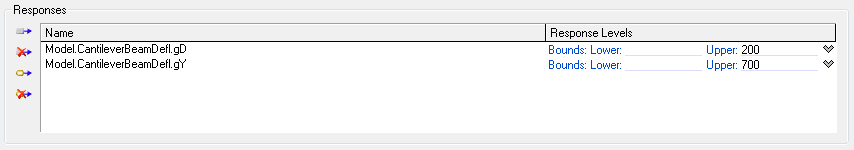
Selecting Response Variable Bounds
The response variable should be set up so that failure region can be properly identified. When response values smaller than a limit are considered as failure cases, specify a lower bound. The probability of failure (along with the corresponding reliability) will be computed as:
- Pf (probability of failure) = Probability(response variable < lower bound)
- Reliability = 1 - Pf
If values greater than a particular limit represent failures, set an upper bound. The probability of failure will be computed by:
- Pf (probability of failure) = Probability(response variable > upper bound)
- Reliability = 1 - Pf

If values beyond two particular distinct values represent failure and all values lying between the two distinct values represent the safe region, set the lower limit value as the Lower bound and higher limit value as the Upper bound. The tool will consider all values greater than upper bound and lower than lower bound as failure whereas values within both bounds will belong to safe region. Thus reliability = Pr (Lower bound <= response variable <= Upper bound) and pf = 1 - reliability.
If a response value must be within a specific range for safe operation, specify both the lower and upper bounds. The probability of failure and the corresponding reliability will be computed by:
- Reliability = Probability(lower bound < response variable < upper bound)
- Pf = 1 - Reliability
Selecting Response Variable Probability Values
Testing for Probability values will give results as performance levels. The performance level numbers are the response values of the function for which the probability is less than or equal to the corresponding value from the probability of the performance. Thus if P(z <=Z) = p then z= response value for corresponding p.
|
All probabilities must be between the values of 0 and 1. |
To test a probability, select the desired response variable's Response Level and change it to Probability Value. Clicking on the blank line after Probability Value will allow for user input to test a single probability value. Monte Carlo, EGRA, AMV+ - IS, FORM - IS, AMV+ - MAIS, and FORM - MAIS methods do not support Probability Values and Generate CDF options.
Selecting Response Variable Performance Levels
Testing for Performance Levels will give results as Probability Values. The numbers for probability are the response values of the function that are less than or equal to the performance level specified.
To test a performance, select the desired response variable's Response Level and change it to Performance Level. Clicking on the blank line after Probability Value will allow for user input to test a single performance level.

Selecting Response Variable Generate a Cumulative Distribution Function (CDF)
When the Response Levels option is "Generate a Cumulative Distribution Function (CDF)", a CDF graph will appear as a tab under View Output and will show the total probability of each response occurring for any value it could possibly hold. The y-axis represents the cumulative probability, with values between 0 and 1 and the x-axis represents the values of the response variable. The CDF is useful tool to asses how a distribution fits the data because it measures the total probability as the value of the response changes, rather than the probability at certain point. The CDF plot can be used to gauge the range of the response variable. Monte Carlo, EGRA, AMV+ - IS, FORM - IS, AMV+ - MAIS, and FORM - MAIS methods do not support Probability Levels and Generate CDF options.

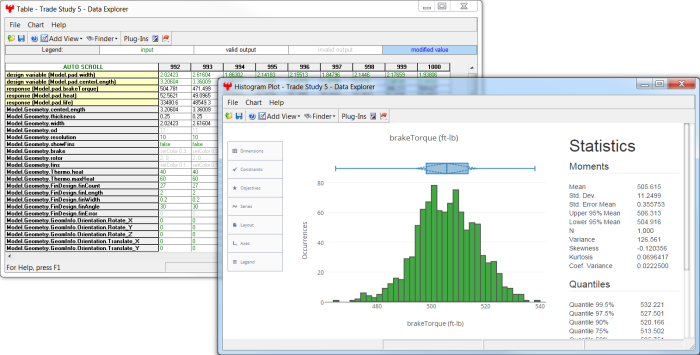
In probabilistic analysis output, the CDF is the probability that the measured variable takes a value less than or equal to x. Looking at the graph above, it is easy to see the range of values that gD can hold that will have a probability of it actually taking on that value. Probabilistic Analysis Tool uses 10 probability values listed here:
0.28716598E-06, 0.31688054E-04, 0.13496402E-02, 0.22747974E-01, 0.15864683, 0.84133901, 0.97724872, 0.99864996, 0.99996831 & 0.99999971
It then uses the method to compute corresponding response values. Each response run with the method will have its own CDF generated. The dropdown menu labeled "Response:" controls which variable's CDF is currently displayed. It is important to note that a CDF will only be generated if "Response Levels" tab from the Probabilistic Analysis Tool window has the option "Generate a Cumulative Distribution Function (CDF)" selected. The CDF plot is also used to plot real probability values when you have selected "Performance Levels" or "Probability Levels". In both these cases the plot does not show a CDF but just plots probability values against response values.

Selecting a Probabilistic Analysis Method
The probabilistic method can be selected using the Method drop-down box.
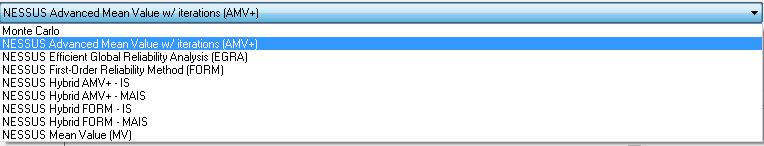
The drop-down selection includes both a random sampling method and several analytical methods. Monte Carlo is the traditional random sampling method that generally requires a very high number of function evaluations. Because it requires a very large number of function evaluations, Monte Carlo is usually not suitable for estimating the probability of rare events such as failures. The analytical methods automatically construct and use approximations to the response functions and generally require a much smaller number of function evaluations. To help users choose a method that is best suited to a given problem, a Method Selection Wizard is available. More details about the methods are also available.
Probabilistic Method Options
Options for each method can be modified via the options dialog, which is accessed from the Options button. For detailed information about the options, please consult the methods help page.
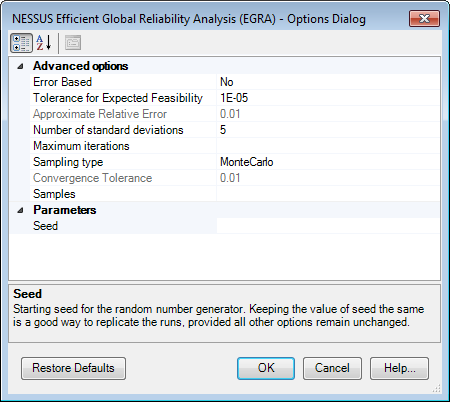
The Options dialog shown above is for the NESSUS Efficient Global Reliability Analysis (EGRA). Parameters specific to the method are shown in this dialog. The options can be changed to control the operation and performance of the method. When an option is selected for edit, a brief description about the option will appear in the lower part of the dialog. The Restore Defaults button can be used to discard any changes and revert to default options.
Performing Probabilistic Analysis
To start the analysis run, press the Run button. The Probabilistic Analysis Tool runs the model for sampling points to compute probability of failure and reliability. The status bar at the bottom of the interface will display Status messages about the progress of the probabilistic analysis. The status messages can also be viewed in the Messages tab of the Output window.

When the Probabilistic Analysis Tool is run from the GUI, the results will be stored in the Data Explorer. The sampling data generated by Monte Carlo can be used to create plots and analyze statistics about the response variables. The sampling data generated from the analytical methods is less useful for plots since they make only a few model evaluations focused on the failure region. For analytical methods, the results from the View Output… window are the most useful. A probabilistic analysis can be stopped while it is running by pressing the Stop button on the Probabilistic Analysis Tool GUI or by pressing the Halt button in the Data Explorer.
Resuming an Unfinished Analysis
The Probabilistic Analysis Tool supports resuming an analysis that was not fully completed (such as one that was halted or crashed). This allows you to continue an unfinished analysis from near where you left off, instead of having to start again from the beginning. If an analysis is capable of being resumed, the Resume button on the tool will be enabled. Any changes to the tool options or setup will disable the Resume capability.
Viewing the Probabilistic Analysis Output
Details of the probabilistic analysis can be viewed by pressing the View Output button. This button can be pressed either while the analysis is running or after it has stopped.
Add to Existing Data Explorer
The Probabilistic Analysis Tool provides a way to refine the analysis (by adding more data) after a Monte Carlo study is finished. If the option, Add to Existing Data Explorer, is checked, newly computed samples will be appended to the previously generated data set. Note that this option is applicable only to the Monte Carlo method. By adding more data to Monte Carlo analysis, more accurate results can be obtained. Plots such as the Histogram Plot will show the statistical metrics for the combined data set.
Adding the Probabilistic Analysis Tool to the Model
Once a probabilistic problem has been set up, it may be inserted into the Model as a Driver Component. To add the Probabilistic Analysis Tool to the Model, press the Add to Model button. The Probabilistic Analysis Tool will be added as a Component in the Model and the Tool GUI will be closed.
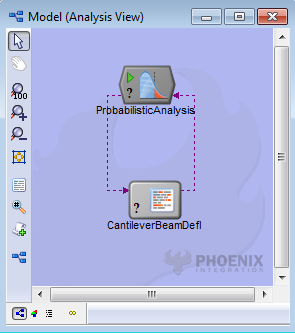

In the figure shown above, the component tree on the left is for Monte Carlo while the one on the right is for NESSUS EGRA. Monte Carlo provides more statistics for the response variables when run because it is a sampling technique. Various moment values can be accessed from the component tree. Efficient analytical methods only return a probability of failure and reliability value.
To reopen the tool GUI, double-click the component in the model. If any problem setup was changed in the GUI for an embedded probabilistic analysis, the tool will prompt the user to save the changes before running the analysis (see in the following figure):
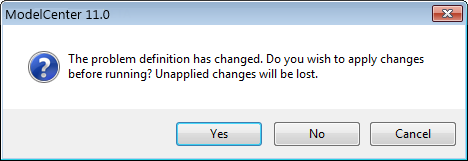
If the Yes button is pressed, the setup changes will be applied to the embedded component and the analysis will start. If the No button is pressed, the changes made in the GUI will be discarded and the analysis will be performed using the original problem definition in the embedded component. The Cancel button cancels the run operation.
See Also Parametric Study Tool | Carpet Plot Tool | DOE Tool | Probabilistic Analysis | Optimization | Data Explorer