Debugging |
Application code can contain various errors and bugs. This section provides information on using the debugger to step through the execution of tasks.
This section explains the following:
This section assumes it is possible to access one of the agent machines (in development, this can be the same development machine) and the ability to change and recompile the code in a task. To get ready, compile the client application in debug mode to generate the PDBs. For easier debugging, it is recommended that only one task is submitted in the job. Follow these steps:
Launch the Debugger
Edit the task code to add a DebuggerLaunch line. If running only on a local machine, this should work most of the time.
[Serializable]
public class TaskThatNeedsToBeDebugged : Task
{
    public override void Execute()
    {
        System.Diagnostics.Debugger.Launch();

        // Rest of the task function.
    }
}
A common pattern developers use is to surround the Debugger.Launch with a #if DEBUG so it always launches when the application is running in debug mode but never in release mode.
    [Serializable]
    public class TaskThatNeedsToBeDebugged2 : Task
    {
        public override void Execute()
        {
#if DEBUG
            // Always launch debugger in debug, but never in release.
            System.Diagnostics.Debugger.Launch();
#endif
        }
}A common issue when running the agent as a Windows Service is that Visual Studio might crash before the debugger can attach. When debugging, make sure to run the Agent in console mode to avoid this issue. |
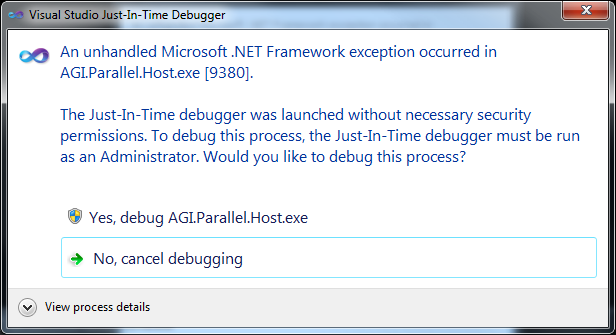
Visual Studio will ask to attach the debugger to the process, answer yes.

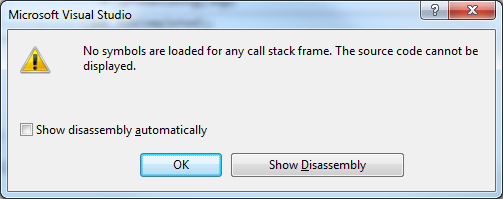
In some cases, Visual Studio might not recognize debug symbols.  This type of error is due to how assemblies are resolved. Assemblies needed to resolve a Task type are streamed through the system to the host process. In some environments, when an assembly is streamed the symbols do not work. The solution to this problem is to resolve assemblies before they are automatically resolved. One way to work around this issue is by copying all the assemblies in the application folder into the location of your agent. For instance: C:\Program Files\AGI\STK Parallel Computing Server 2.10\Agent\bin. This works because one of the ways .NET resolves assemblies is by looking at the directory of the running process - in this case AGI.Parallel.Host.exe. Make sure to revert this operation after you are finished debugging. If the code still can't be stepped through after all these options are exhausted, read this document for more ways to resolve assemblies. |
There is an option available to automatically attach the debugger to client applications when debugging in Visual Studio. This is very useful because it removes all the manual error prone steps that are associated with attaching to a process.
Prerequisites:
- Client is running on the same machine as the host processes.
- Works seamlessly with the embedded job scheduler.
Set the AttachToDebugger property on the TaskEnvironment object. Optionally set the DebuggerType property to specify the type of debugger (Managed, Native, Mixed), otherwise the default debugger is used.
using (EmbeddedJobScheduler scheduler = new EmbeddedJobScheduler())
{
    scheduler.Connect();
    scheduler.CreateJob();
    Job job = scheduler.CreateJob();
    job.AddTask(new TaskThatNeedsToBeDebugged());

    // Set the AttachToDebugger to true
    job.TaskEnvironment = new SimpleTaskEnvironment();
    job.TaskEnvironment.AttachToDebugger = true;
    job.TaskEnvironment.DebuggerType = DebuggerType.Managed;
}
When the host processes start they automatically attach to the Visual Studio instance debugging the client application. To debug, just start the client application in the debugger. Put breakpoints in the task environment and task code. The debugger will stop as expected. The processes triggering the breakpoint can be viewed in the debugger Processes window (to bring it up use: Debug menu -> Windows and Processes option).
