Troubleshooting |
The topics in this section describe ways to diagnose problems that might arise and techniques for capturing information when they do occur.
In this section the following is explained:
Tasks can write debugging statements to the log and standard output. First, if it is not already running, open the Coordinator Tray Application located at the default location of C:\Program Files\AGI\STK Parallel Computing Server 2.10\Coordinator\bin\AGI.Parallel.CoordinatorTray.exe. The Tray application needs to be started before the task is submitted. Once the tray application is up, any task submitted to the Coordinator will be displayed.
Open the task monitor to view the list of submitted and running/completed tasks:
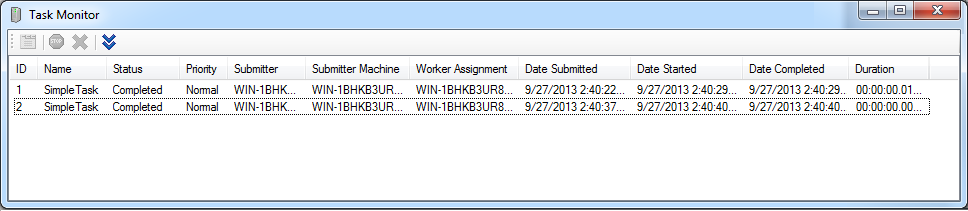
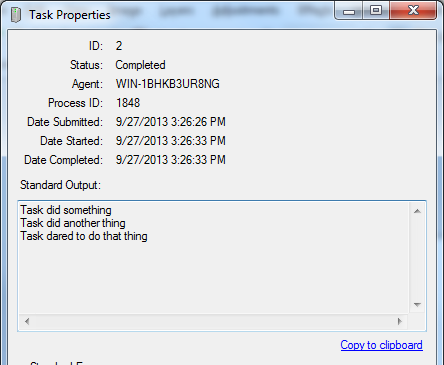
Double-click a task to view its standard output and standard error. For example, a task can write a number of trace statements to standard output.
    public static class YourTask extends Task {
        @Override
        public void execute() {
            // Do something
            System.out.println("Task did something");

            // Do another thing
            System.out.println("Task did another thing");

            // Dare to do that thing
            System.out.println("Task dared to do that thing");
        }
    }
When a task is finished, the trace statements can be viewed in the task properties window. This can be an easy way to troubleshoot many issues within tasks.
The Coordinator, Agent, and Hosts all write logging information to disk. This can be useful when troubleshooting issues. Information in the log includes system messages, times when tasks change state, and any error information encountered. User defined messages can also be logged. See instructions at Log messages in task. There are two ways to view the log files, through the GUI monitoring applications or directly viewing the log files themselves.
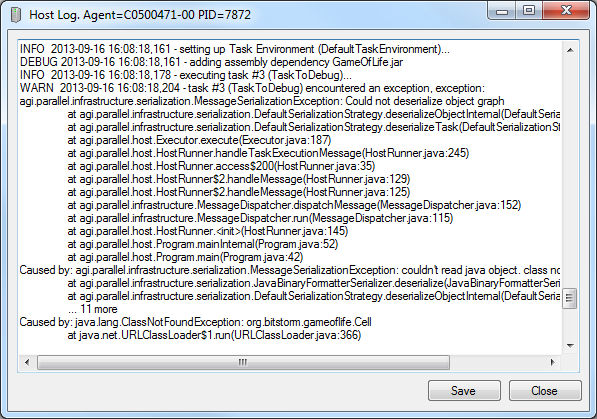
The Coordinator Monitor GUI provides the host log files. Start the task monitor and right click on a task to view.
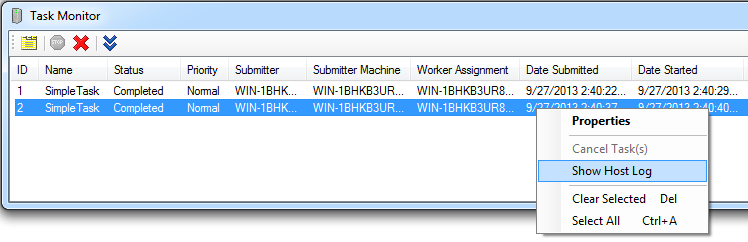
...and click Show Host Log.
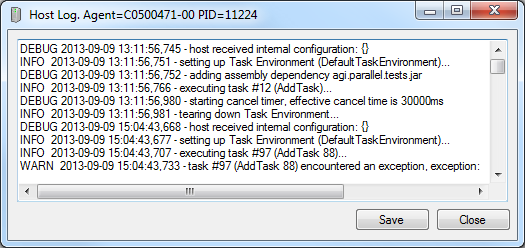
If the GUI monitoring applications are not available, view the log files by opening the files manually. The default location of the host log files is C:\ProgramData\AGI\STK Parallel Computing Server 2.10\logs. The naming convention of a log file is "java-" with the host process id appended. For example, java-7872.log would be the log for the Java host process with the process id of 7872.
In Windows Explorer, sort the log files by the date most recently modified in decreasing order. The most recent logs should correspond to the most recent tasks. |
When troubleshooting an application logic error, it can be beneficial to simplify the problem into smaller pieces. Here are some useful tips:
- Add only a single task to the job.
- Simulate the calling sequence.
- First make sure it works on a local machine. Incrementally add machines to the cluster until the problem is found.
- If it works on one machine but not another, check that it is not a user rights issue.
- See if the same problem exists when executing the code directly, without executing it in a job/task.
Check the status of the task. Did it fail? Was there an exception? For many cases, Task.StandardError will contain a clue to the problem.
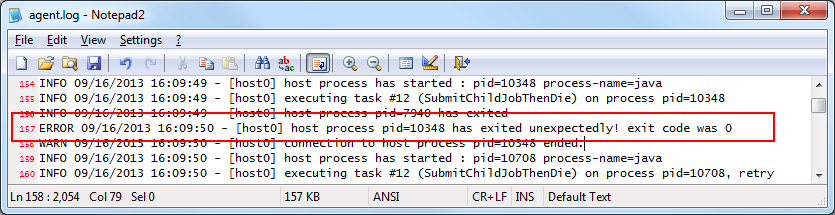
Check the log files. Are there any errors (search for the "ERROR" string in the logs)? Check the exit code of the host process. The agent writes a log entry if the exit code of a process is not expected. If the agent exits gracefully, the exit code is not logged.
Check if there are any messages in the Windows Event Viewer. Instructions are available here.
There are a few tools provided to measure the execution times of tasks.
You can get the total run time of a task using task.getProperty(TaskProperties.HostStartTime) and task.getProperty(TaskProperties.HostEndTime). The times returned from the method are the start and stop time of the task's Execute method. This does not include the task environment's setup time.
GregorianCalendar startTime = (GregorianCalendar) task.getProperty(TaskProperties.HOST_START_TIME);
GregorianCalendar endTime = (GregorianCalendar) task.getProperty(TaskProperties.HOST_END_TIME);
System.out.println("Task start time: " + startTime);
System.out.println("Task end time: " + endTime);
long duration = endTime.getTimeInMillis() - startTime.getTimeInMillis();
System.out.println("Duration: " + duration + "ms");
Also, the logs that are written all show the times for different events that happen in the system.
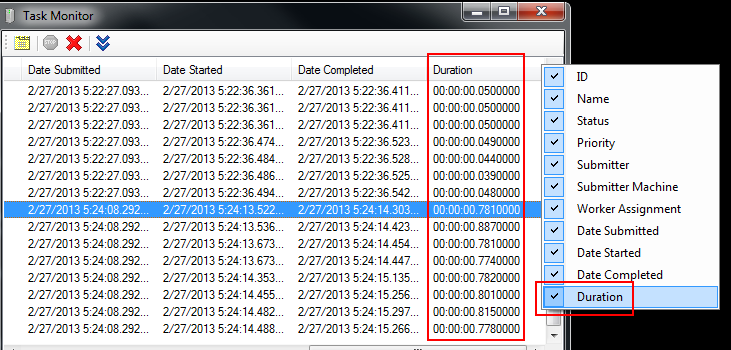
Finally, the duration time of tasks can also be viewed using the Task Monitor.
If a task doesn't make any progress in the execute method it is likely that it is blocked. There are many cases where the reason is application specific, for instance a deadlock bug that needs to be fixed in the task. In other cases, it's something that may not be intuitive.
Is there a UI prompt in the task? There can be issues when a task is ported from a legacy application to a task and a UI prompt is not removed, causing the task to wait forever.
Are there issues with the user rights? If the agent is running as a SYSTEM user, is there an issue in the task?
Setting Job.TaskExecutionTimeout to a reasonable value is a good way to allow a graceful failure.