Logging Messages and Debugging Delegates
Overview
As when writing any custom code, when writing your delegates you will likely want to have them log messages and to debug them in your Integrated Development Environment (IDE). Behavior Execution Engine makes both of these tasks more convenient by providing a built-in simulation logger. In this section, you will debug an exception using log messages.
This section covers the following concepts:
- The Behavior Execution Engine SimulationLogger
mSimulationLogger.info("currentPowerDraw=" + currentPowerDrawProperty.getValue());
mSimulationLogger.info("powerRequest=" + powerRequestProperty.getValue());
mSimulationLogger.info("maxPowerDraw=" + maxPowerDrawProperty.getValue());
Figure A1: Logging property values in a delegate
Prerequisites
| Prerequisite | Description |
|---|---|
| Behavior Execution Engine Installation | You must have installed Behavior Execution Engine and have the prerequisites for developing delegates for Behavior Execution Engine. |
| Tutorial Project | You must start this section with the UAV Mission simulation project and delegate module project from the previous section. If you did not complete the previous section, you can use the files from the Behavior Execution Engine installation: \documentation\tutorialFiles\03\DelegateWireUp, but you may still need to configure the delegate module for your environment. |
| Recommended Reading |
Before completing this section, you may want to read the following help topic:
|
Instructions
Examine the error log
- Open the UAVMission.mdzip project from the previous section.
- Execute the simulation
and observe that the simulation fails with the following exception:
This indicates that the
ERROR: java.lang.Exception:
com.agi.moxie.uml.infrastructure.expressions.JexlExpressionParser.parseBooleanExpression:35
variable 'powerRequest' is undefined within guard source text:
currentPowerDraw + powerRequest < maxPowerDrawpowerRequestproperty used in thecurrentPowerDraw + powerRequest < maxPowerDrawguard isnullwhen the guard is evaluated.
Log the property values
After you include the SimulationLogger dependency
from the analysis tool controller in your delegates,
you can use it to log messages to the simulation log file and console.
-
In the state history trace for the
PowerSystem State Machine,
notice that the
providePower()operation executes immediately before the guard that is throwing the exception. Unlike the guard, this operation has corresponding delegate code in which you can log the values of the properties used in the guard. -
In the
PowerSystemDelegateclass, add the following import statement:import com.agi.moxie.api.SimulationLogger; -
Add the following private field:
private SimulationLogger mSimulationLogger; -
Add the following dependency injection and field initialization in the constructor:
public PowerSystemDelegate( ...
        @InjectByName("simulationLogger") SimulationLogger simulationLogger,
         ... ) {
    mSimulationLogger = simulationLogger;
     ...
} -
Add the following logging statements for the SysML property values in the
providePower()method:mSimulationLogger.info("currentPowerDraw=" + currentPowerDrawProperty.getValue());
mSimulationLogger.info("powerRequest=" + powerRequestProperty.getValue());
mSimulationLogger.info("maxPowerDraw=" + maxPowerDrawProperty.getValue()); - Save your work and reinstall the delegate module.
- Execute the simulation again
and observe that the simulation now reports the following information before the exception:
INFO: currentPowerDraw=3.0
INFO: powerRequest=null
INFO: maxPowerDraw=100.0
Set the null property value
In the SysML model, the computer requests that the power system providePower() for specific subsystems,
so the power system should store the value that the computer requests in the powerRequest property.
-
Add the following code before the logging statements in the
providePower()method to set the property:powerRequestProperty.setValue(request); - Save your work and reinstall the delegate module.
- Execute the simulation again
and observe that the simulation no longer throws the exception for
nulloperands in the guard and that it completes successfully.
Debugging State Machines
Regardless of whether the "Debug Mode" is active, the SysML Client also supports setting breakpoints inside the SysML state machines to pause execution. When using the Ansys Systems Tool Kit® (STK®) application, this enables you to pause execution to run additional reports, graphs, and perform ad-hoc analysis to diagnose potential issues occurring at specific moments in the flow of SysML behaviors.
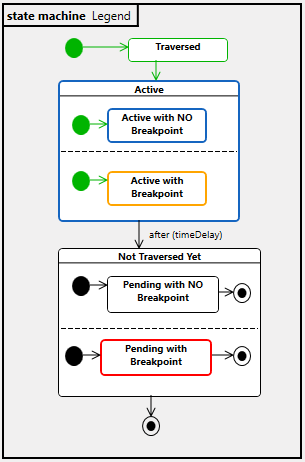
Figure A2: Color Legend for debugging SysML state machines
For more details, see the section on debugging in the Debugging with State Machines overview.
Next Section >