Simulation Execution
When executing a
Moxie
simulation, make sure to use the Run ( ) button on the main
Simulation Execution toolbar. If you do not see the toolbar,
select View > Main Toolbars > Simulation Execution.
You can also run a simulation from a simulation configuration diagram by right-clicking in the diagram
and selecting Simulation > Run
(or by pressing ).
Do not use the Run () button on the diagramming toolbar, as this will not
trigger Moxie to execute.
) button on the main
Simulation Execution toolbar. If you do not see the toolbar,
select View > Main Toolbars > Simulation Execution.
You can also run a simulation from a simulation configuration diagram by right-clicking in the diagram
and selecting Simulation > Run
(or by pressing ).
Do not use the Run () button on the diagramming toolbar, as this will not
trigger Moxie to execute.
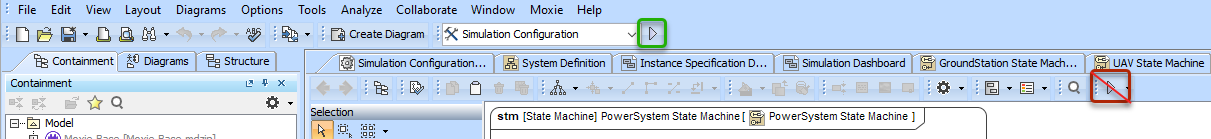
Figure 1: Finding the correct Run button
Dashboard
Figure 2 shows a Simulation Dashboard, which is technically just an object diagram.
An object diagram typically depicts the logical parts of a software system or subsystem, but for Moxie, it is useful
for monitoring a simulation as it executes.
This dashboard enables you to visualize the execution of multiple behaviors in real time, in one place.
As you create new state machine diagrams, you can manually add them to the dashboard by dragging them over from the
Containment Tree,
dropping them in the diagram, and clicking the eye icon to display them.
Moxie
does not require a
Simulation Dashboard, but you will likely find it is a great
visualization and debugging tool.
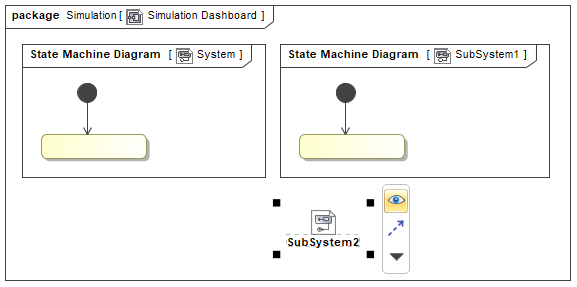
Figure 2: A simple Simulation Dashboard
Log
The Cameo Simulation Toolkit's simulation log file is where you will find all Moxie, No Magic, and custom delegate output from your simulation run. If your simulation terminates unexpectedly, look at the end of the log to find the exception that was thrown. Many times you will also find additional context that will aid you in identifying a solution to the problem. The log file is stored in your No Magic modeling tool's configuration files location, which is listed at Help > About > Environment > Configuration Files. You can also browse to this location directly by clicking Moxie > Open Log File Directory in File Explorer (or by pressing ). The default name of the file is simulation.log.
All messages logged to the simulation log file are also displayed in the simulation console (Figure 3). You can filter the messages in the simulation console by severity by clicking the filter selection box in the upper right corner of the console. You must do this prior to running a simulation in order to take effect.
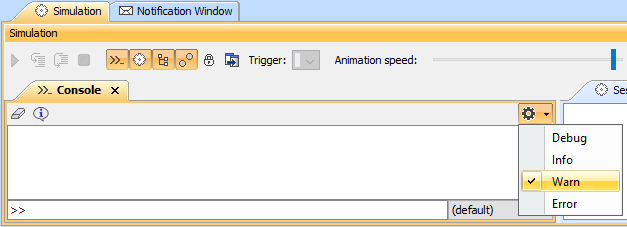
Figure 3: Log severity options in the Simulation Console
State history
The simulation state history log file is a JSON representation of the most recent simulation run. It contains sequential entries for each state entered and exited and for each transition traversed. Each entry includes metadata about the state or transition, including the simulation time and the name and ID of the instance. The name of the log file is moxie_simulation.json and you can find it adjacent to the simulation log file. This file is overwritten with each simulation run, so if you plan to compare simulation runs, be sure to save a copy of each run under a different name or in a separate directory after it completes.