The results of the tutorial may vary depending on the user settings and data enabled (online operations, terrain server, dynamic Earth data, etc.). It is acceptable to have different results.
Problem Statement
With the increased global seismic activity, Italian intelligence would like to collect as much visual imagery as possible on one of the greatest tourist attractions; the Roman Colosseum. They need to monitor the geography of the area around the Colosseum as well as the structural integrity of it.
To do this, Italy has enlisted the help of the U.S. to take as many pictures of the Colosseum as possible and get them to White Sands or Guam within the next three weeks.
Break It Down
You have some information that may be helpful. Here’s what you know:
- It must be daylight at the Roman Colosseum when you take the pictures.
- The cameras attached to Landsat 7 and 8 can take pictures of the Colosseum.
- Each camera has a fifteen (15) degree by four (4) degree rectangular lens.
- You CANNOT downlink directly from Landsat to White Sands Ground Terminal (WSGT).
- You CAN uplink from the Landsat site to TDRSS 3, 5, and/or 10.
- You CAN downlink from TDRSS 3, 5, and/or 10 to White Sands or Guam Remote Ground Terminal (GRGT).
- The Colosseum is located at 41.89 latitude and 12.4935 longitude.
- You have a KML file that models the Colosseum that you want to use in the 3D Graphics window.
- You CAN promote the KML file to an STK object and use it for analysis.
Solution
Build a scenario that can be used to determine when you can take near-real-time images of the Colosseum, in the daylight over the next three weeks using the cameras attached to Landsat 5 or 7. After you take the images, you need to uplink to one of the TDRSS satellites, and then downlink to your White Sands, NM or Guam site.
Wow, that’s a mouthful! Let’s sketch that out, and see if it makes more sense. It all looks something like this:
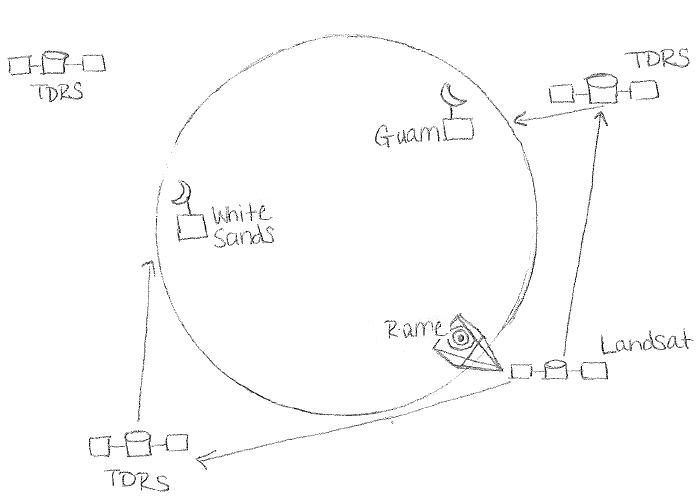
Problem Sketch
Model the World!
You will, again, build your analysis from the ground up. First, you need to define the analysis time period of the conditions that you set for your world and the objects in your world. You know that your period of analysis will be three weeks because that’s how long you have to collect the data that you need. Define a two week analysis period.
- Click the Create a New Scenario button.
- Enter the following in the New Scenario Wizard:
- When you finish, click OK.
- When the scenario loads, click Save (
 ). A folder with the same name as your scenario is created for you in the location specified above.
 - Verify the scenario name and location and click Save.
| Option | Value |
|---|---|
| Name | Image_Relay |
| Description | How can I take pictures of the Colosseum and relay them in near-real-time? |
| Location | C:\Documents and Settings\<user>\My Documents\STK 11\ |
| Start | 1 Jul 2016 16:00:00.000 UTCG (Note: use the word Tomorrow if you are not completing the L3 quiz) |
| Stop | + 21 days |
On the Ground
The first thing you need to do is model a few locations on the ground. To start, you’ll model:
- The city of Rome.
- The White Sands site.
- The Guam site.
Manage Terrain, Imagery and Globes
The Globe Manager is used to create a profile for a globe in the 3D Graphics window by applying and managing world background textures (*.wtm), image inlays (*.jp2 and *.pdttx), terrain inlays (*.pdtt), specular textures (*.wtm) and night light textures (*.wtm) from multiple sources, both local and external, to create a globe profile. Profile items can then be set to be displayed or hidden in the 3D Graphics window and organized into sets which can be turned on and off in the 3D Graphics window.
Using the Globe Manager you can display different globe features in different 3D Graphics windows and display different aspects of a scenario globe in multiple 3D Graphics windows. Each 3D Graphics window has its own globe profile that can be edited independently. Globe profiles can be saved in STK's GLB file format. These GLB files can be imported into the Globe Manager and shared with other users.
Keyhole Markup Language (KML) Files
Keyhole Markup Language (KML) is an XML based language scheme for expressing geographic annotation and visualization on existing or future Internet-based, two-dimensional maps, and three-dimensional Earth browsers. KML was developed for use with Google Earth, which was originally named Keyhole Earth Viewer. It was created by Keyhole, Inc. which was acquired by Google in 2004. The name Keyhole is an homage to the KH reconnaissance satellites, the original eye-in-the-sky military reconnaissance system first launched in 1976.
KML is an international standard of the Open Geospatial Consortium. Google Earth was the first program able to view and graphically edit KML files. The KML file specifies a set of features (placemarks, images, polygons, 3D models, textual descriptions, etc.) for display in Google Earth, Maps and Mobile, or any other 3D Earth browser (geobrowser) implementing the KML encoding. Each place always has a longitude and latitude. KML files are very often distributed in KMZ files, which are zipped files with a KMZ extension.
AGI has provided you with a KMZ file (*.kmz) from Google Earth’s online Gallery (retrieved February 2012). You can obtain your own KMZ files (*.kmz) files by exploring the Google http://earth.google.com.
Use Globe Manager to Load the KML File
You would like to view the Colosseum as a model in the 3D Graphics window. You have a KMZ file that models the Roman Colosseum. You can use the STK Globe Manager to inlay the KML file for visualization in the 3D Graphics window.
- If you are completing the L3 quiz at the end of this lesson, disable the Terrain Server option.

- Open the scenario's (
 ) Properties (
 ).
). - Select the Basic - Terrain page.
- Disable the User Terrain for analysis option.
- Click OK to apply the changes and dismiss the Properties Browser.
- Bring the 3D Graphics window to the front.
- Launch the Globe Manager (
 ).
). - Select the KML tab in the Globe Manager.
- Click the Open KML Content (
 ) button.
 - Browse to the location of your KML file. (typically, <STK install folder>/Help/stktraining/KML)
- Select romecolosseum.kmz.
- Click Open.
The ability to use KML data was added in STK 9.2. You will need a valid install of STK 9.2 or later.
It may take a moment for the KMZ file to load into STK.
View in 3D Graphics Window
- Select the model directory in the KML browser.
- Click the Zoom To (
 ) button.
 - Close the informational dialog. The message informs you that the model was created using Google Sketchup.
- Mouse around in the 3D Graphics window until you can clearly see the Roman Colosseum.

3D View: Roman Colosseum
Promote the KML Model to an STK Object
You need to be able to use the Colosseum for analysis in STK, so you can promote it to an STK object. Since the Colosseum is the target of your imaging satellites, we will promote it to an STK target object.
- Expand (
 ) the Model directory.
 - Expand () the Tour directory.
- Right-click the Model option.
- Select the Import as Target option from the menu.
- Rename the new Target (
 ) object Colosseum.
View in 2D Graphics Window
- Bring the 2D Graphics window to the front.
- Zoom In (
 ) on the map in the 2D Graphics window so that you can clearly see the Colosseum.
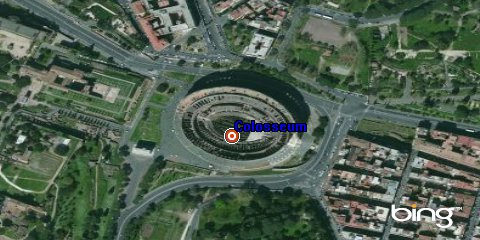
2D View: Colosseum in 2D
Add the City of Rome
It occurs to you that the images you collect might be of value to the Italian government if they showed more of Rome than just the Colosseum.
- Just how far away from the center of Rome is the Colosseum?
- Bring the Insert STK Objects tool (
 ) to the front.
 - Select the following:
- Click the Insert... button.
- When the City Database Search tool appears, enter the following criteria:
- Click Search.
- When the search results appear, double-click the Rome, Lazio Province of Italy entry to insert it in the scenario.
- Close the Insert From City Database tool.
| Option | Value |
|---|---|
| Select an Object to be Inserted: |
 Place Place |
| Select a Method |
 From City Database From City Database |
| Option | Value |
|---|---|
| City Name | Rome |
| Auto Select Color | On |
How Far is Rome Center to the Colosseum?
Now that you have a location for Rome, just how far is it from Rome center to the Colosseum? How far is it if you go by a road? You can use the measuring tool in the 2D Graphics window to find out.
- Select the 2D Graphics window.
- Zoom out until you have both the center of Rome and the Colosseum in view.
- Click the Measure (
 ) tool.
 - Click on the Colosseum and drag a line to Rome ().
The Measure tool measures the distance between any two points in the 2D Graphics window. You must make sure the Message Viewer and/or the Status Bar are visible in the STK Workspace. The Measure tool calculates the shortest distance between two points and the azimuth bearing display in the Status Bar and the Message Viewer.
3D Measure Tool
The 3D Measure tool was added in STK 11.1. It measures the distance between any two points in the 3D Graphics window. Let's check the distance between the Colosseum and Rome in the 3D Graphics window.
- Select the 3D Graphics window.
- Zoom out until you have both the center of Rome and the Colosseum in view.
- Click the 3D Measure () tool in the 3D Graphics Window toolbar.
- Click on the Colosseum and drag a line to Rome ().
- To calculate another distance, click the ruler icon in the 3D Measure pop-up window, then click the first point and drag a line to the second point.
- How far is it between the Colosseum and Rome?
Model Ground Sites
You’ll use the information in the Facility Database to model the sites in your Space Flight Tracking & Data Network (STDN).
- Return to the Insert STK Objects tool (
 ).
). - Select the following:
- Click the Insert... button.
- When the Facility Database Search tool appears, enter the following criteria:
- Click Search.
- When the search results appear, double-click the first White_Sands entry to insert it in the scenario.
- Change the search criteria as follows:
- Click Search.
- When the search results appear, double-click the first Guam1 (GU1) entry to insert it in your scenario.
- When you finish, close the Insert Facility from Facility Database tool.
| Option | Value |
|---|---|
| Select an Object to be Inserted: |
 Facility Facility |
| Select a Method |
 From Standard Object Database From Standard Object Database |
| Option | Value |
|---|---|
| Name | WSGT |
| Option | Value |
|---|---|
| Name | Guam |
Group Your Ground Sites
In your scenario you have the two ground stations used by the TDRSS system. In addition to including them in your scenario, you want to group them together for analysis. How do you create a constellation with objects already contained in your scenario? This is not a problem. In addition to having STK create a constellation using objects selected during the object creation process, you can also manually create an “empty” constellation and assign objects yourself. Let’s try it.
- Use the Default Object tool to create a constellation object (
 ).
). - Rename the constellation TDRS_Ground.
- Open TDRS_Ground’s () properties (). The Basic - Definition page should already be selected.
- Use the Selection Filter to select all of the facilities () in the scenario.
- With the Selection Filter on, move (
 ) all of the facilities in the scenario to the Assigned Objects list.
 - Click OK.
Model Spacecraft
You have a world, and you’ve defined all relevant points-of-interest on the ground. Now, it’s time to look to the sky. Your scenario still needs the Landsat satellites.
- Return to the Insert STK Objects tool ().
- Click the Insert... button.
- Set the Name or ID field to Landsat.
- When the search results appear, select Landsat 7 and Landsat 8.
| Option | Value |
|---|---|
| Select an Object to be Inserted: |
 Satellite Satellite |
| Select a Method |
 From Standard Object Database From Standard Object Database |
Model Landsat's Sensors
The Landsat 7 and Landsat 8 satellites have been added to your scenario but you need to model the cameras. We are going to use sensors to model the cameras. The payloads (sensors) should have been added to the scenario if you used the AGI Standard Object Database to bring in the satellites. If not, then use the steps below to add them.
Landsat 8 has two attached payloads, check the field-of-views for both sensors. You will use the sensor with a Horizontal Half Angle of two (2) deg. Delete the other sensor to clean up the Object Browser.
- Attach a sensor (
 ) to Landsat 7 ().
 - Open the sensor's () properties ().
- Select the Basic - Definition page.
- Set the following options:
- Click OK.
- Copy (
 ) that sensor () and paste (
 ) it on the Landsat 8 () since they have the same camera.
| Option | Value |
|---|---|
| Sensor Type | Rectangular |
| Vertical Half Angle | 7.5 deg |
| Horizontal Half Angle | 2 deg |
Group Your Landsat Satellites
- Use the Object Catalog to create a constellation object ().
- Rename the constellation Landsat_Sats.
- Open Landsat_Sats’ () properties (). The Basic - Definition page should already be selected.
- Use the Selection Filter to select all of the Landsat satellites () in the scenario.
- With the Selection Filter on, move () all of the satellites in the scenario to the Assigned Objects list.
- Click OK.
Group the Cameras
Now, you need to create a constellation for the two cameras that you created because you want them to be considered as a unit also.
- Use the Object Catalog to create a constellation object ().
- Rename the constellation CamerasFOV.
- Open CamerasFOV’s () properties (). The Basic - Definition page should already be selected.
- Use the Selection Filter to select all of the sensors () in the scenario.
- With the Selection Filter on, move () all of the sensors in the scenario to the Assigned Objects list.
- Click OK.
Model the TDRS Network
Now that you have the Landsat satellites and cameras modeled, let's insert the TDRS satellites. You can use the Standard Object Database to do that.
- Return to the Insert STK Objects tool ().
- Select the following:
- Click the Insert... button.
- When the Satellite Database Search tool appears, enter the following criteria:
- Click Search.
- When the search results appear, select TDRS 3, TDRS 5, and TDRS 10.
- Click Insert.
- When you finish, close the Satellite Database Search tool.
| Option | Value |
|---|---|
| Select an Object to be Inserted: |
Satellite |
| Select a Method |
From Standard Object Database |
| Option | Value |
|---|---|
| Name | TDRS |
| Auto Select Color | On |
| Create Constellation from Selected Satellites | On |
| Name | TDRS_Sats |
Change Your Perspective
Before you move on, reposition your 3D view to see what you have done.
- Bring the 3D Graphics window to the front.
- Zoom to the Landsat7 () satellite so that it is the focal point in the 3D Graphics window.
- Reset (
 ) the animation.

3D View: Landsat 7
Define a Chain of Events
It looks like as well as creating and grouping objects you also need to consider the sequence of events.
For example, it wouldn’t do you much good to be transmitting data before you’ve taken images, and it wouldn’t make sense to downlink from TDRSS to White Sands before images were transmitted from Landsat to TDRSS, would it? You need to define a sequence of events whose definition must be met before access is of any interest to you.
- Use the Object Catalog to create a chain (
 ).
). - Rename the chain Rome_To_Ground.
Define the Order of the Chain
Now, you need to define the order of access within the chain. Think about how the chain should be ordered:
- Rome must be visible.
- At least one member of the Cameras () constellation must be able to see the Colosseum.
- The Landsat satellites must be able to transmit to TDRS.
- The member of the TDRS_Sats constellation who receives the images can downlink to either White_Sands or Guam_Leolut1.
Not so tough. Make a chain.
- Open Rome_To_Ground () properties (). The Basic - Definition page should already be selected.
- Move () the following objects to the Assigned Objects list in this order:
- Colosseum ().
- CamerasFOV ().
- Landsat_Sats ().
- TDRS_Sats ().
- TDRS_Ground ().
- Ensure that the objects are in the Assigned Objects list in the order specified.
- Click OK to apply changes and dismiss the Properties Browser.
Constrain Access to Rome
Now, make sure you’ve considered everything before you start your analysis. The first thing that jumps out is the second item--“It must be daylight in Rome when you take the pictures.” How can you ensure that the cameras on the Landsat satellites only take pictures of Rome during daylight hours? To model this, you need to impose a constraint based on the position of the Sun.
- Open Colosseum’s () properties ().
- Select the Constraints - Sun page.
- Enable the Lighting option towards the bottom of the page.
- Select Direct Sun from the drop-down list.
- Click OK to apply changes and dismiss the Properties Browser.
Congratulations! That’s everything. Now, you can answer the original question--When will you have the opportunity to take pictures of the Roman Colosseum and relay them to White Sands or Guam in near-real-time?
When Can I “See” It?
Calculate Complete Chain Access to see when the chain is active.
- Right-click Rome_To_Ground () in the Object Browser.
- Select the Report & Graph Manager (
 ) item from the menu that appears.
 - Set the following:
- Click Generate.
- Use the Complete Chain Access report to answer the following questions:
- Which date has the longest access time?
- What are the most access periods found in one day?
| Option | Value |
|---|---|
| Object Type | Chain |
| Object (Below Object Type) | Rome_To_Ground |
| Show Reports | On |
| Show Graphs | Off |
| Style | Complete Chain Access |
| Generate as | Report/Graph |
Visual Analysis
Look at a complete chain access in the 2D and 3D Graphics windows.
- Right-click the first access time in the Access report.
- Select Start Time --> Set Animation Time from the context menu.
- Select the 3D Graphics window to bring it to the front.
- Click the Home View button (
 ) on the 3D Graphics toolbar.
 - Use the mouse to manipulate the view in the 3D Graphics window so that the entire chain access is visible.
The time of access will be different in your report because your scenario is based on relative time (Today +\-). The animation will be set to start at the beginning of the access period.

Animation toolbar with access times
![]()
Complete Chain Access
When You Finish
- Close the Complete Chain Access report.
- Return to the Report & Graph Manager ().
Who Can See What When?
Calculate Individual Strand Access to see which object in each constellation, made the chain complete at each step.
The Individual Strand Access report is useful when you’re trying to balance timelines against accuracy of assets. For example, using this report (or graph) would help you determine the impact on your mission should any of the satellites or ground stations become inoperable.
- Select the following:
- Click Generate...
- Use the Individual Strand Access report to answer the following questions:
- What is the first satellite to image Rome?
- If either of your Landsat satellites became disabled, would you still be able to complete the chain?
- Are all TDRSS satellites used? If not, which satellite is not used?
| Option | Value |
|---|---|
| Object Type | Chain |
| Object (Below Object Type) | Rome_To_Ground |
| Show Reports | On |
| Show Graphs | Off |
| Style | Individual Strand Access |
| Generate as | Report/Graph |
Save Your Work
- Close any remaining report windows.
- Close the Report & Graph Manager ().
- Save () your work.
 Visit AGI.com