Part 12: Build a Volumetric Object

This training requires additional licenses to complete. You can obtain the necessary license for the training by visiting http://licensing.agi.com/stk/evaluation or calling AGI support.

Volumetrics

The Volumetric object is used to combine spatial calculations and volume grids that enable you to:

  • Report and graph calculations over time and across grid points
  • Visually depict volumes representing various values interpolated across grid points

The spatial calculations and volume grids are defined using the Spatial Analysis tool in Analysis Workbench. This tool allows you to create calculations and conditions that depend on locations in 3D space which are, in turn, provided by user-defined volume grids.

Build an Area of Operations

Watch the following video, then follow the steps below incorporating the systems and missions you work on (sample inputs provided).

a.

  1. Create a new scenario with the default start time and a one (1) second stop time.Closed
    1. Click the Create a new scenario () button.
    2. In the New Scenario Wizard, set the following options:
      • Enter a name for the scenario (e.g. STK_Volumetric).
      • Leave the default analysis Start time and change the stop time to one (1) second.
    3. Click OK.
  2. Enable Terrain for Analysis.Closed
    1. Enable Terrain for analysis if you have Terrain Server (requires Internet ()).Closed
      1. Open the scenario's () properties ().
      2. Enable the Azimuth/Elevation mask option.
      3. Click OK.
    2. Enable Terrain for analysis if you don't have Terrain Server.Closed
      1. Open the Globe Manager.
      2. Click the Add Terrain/Imagery button.
      3. Click the ellipsis button and browse to the location of the PDTT file. (Typically, <STK Install Folder>\AGI\STK11\Help\stktraining).
      4. Select the StHelens_Training.pdtt and click Open.
      5. Click Yes when the warning pops up to Use Terrain for Analysis.
  3. From the Insert STK Objects tool, select Area Target () and select the Area Target Wizard (). This will define the Area of Operations.Closed
    1. Use the Insert Objects Tool to use an Area Target Wizard () to define an Area Target ().
    2. Set the Area Type to Ellipse.
    3. Set the Semi-Major Axis and Semi-Minor Axis to 1500 km.
    4. Set the Latitude and Longitude of the Centroid (e.g. Latitude: 46.6 deg Longitude: -122.3 deg).
    5. Click OK.
  4. Model a place object using the City Database and enable the terrain mask and position above ground for the place.Closed
    1. Search the City Database for Morton.
    2. Insert Morton, Washington.
    3. Open Morton's () properties ().
    4. Select the Basic - Position page and change the Height Above Ground to 20 ft.
    5. You are raising the height of the place above the terrain to represent the height of the sensor.

    6. Select the Basic - AzElMask page.
    7. Enable the Use: Terrain Data option.
    8. Enable the Use Mask for Access Constraint option.
    9. Click OK.
  5. Build a complex conic sensor with a vertical field-of-view that will be used to constrain the volumetric object.Closed
    1. Insert a sensor attached to Morton.
    2. Open the sensor's () properties () and select the Basic - Definition page.
    3. Set the Type to Complex Conic and set the Outer Half Angle to 180 deg.
    4. Select the Constraints - Basic page.
    5. Enable the Az-El Mask option.
    6. Select the 2D Graphics - Projection page and enable the Use Constraints option.
    7. Select the AzElMask option.
    8. Select the 3D Graphics - Projection page and set the Space Projection to 50 km.
    9. Click OK.
  6. View the sensor field-of-view in the 3D Graphics window and see how the terrain is affecting the sensor's field-of-view.

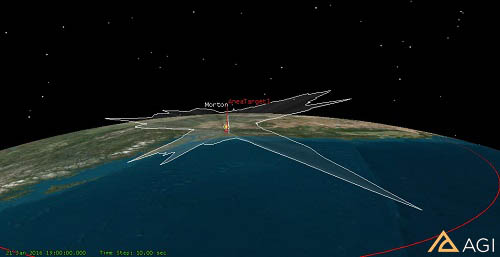
Create Components for the Volumetric Object.

Watch the following video, then follow the steps below incorporating the systems and missions you work on (sample inputs provided).

a.

  1. Insert a Volumetric () object using the Insert Default method.
  2. Create a Spatial Component for the area target using Analysis Workbench that is used to create a grid that visualizes the Volumetric object.Closed
    1. Create a Cartographic Grid Reference frame to constrain the area.Closed
      1. In the Object Browser, right-click on the Area Target () and select Analysis Workbench...
      2. Select the Spatial Analysis tab.
      3. Click the Create New Volume Grid button.
      4. Ensure the Type is set to Cartographic (default).
      5. Enter a name for the volume grid (e.g. SmartCartographic) in the Name field.
      6. If the Parent object is not set to Area Target, click the Select... button and choose the correct parent object.
      7. Click the Set Grid Values button and set the Altitude options. (e.g. Minimum 160 km, Maximum 2000 km, Number of Steps 20).
      8. Click OK to save the volume grid properties and dismiss the Add Spatial Analysis Component window.
      9. Click OK to close Analysis Workbench.
    2. Visualize the Simple Cartographic component.Closed
      1. Right-click Volumetric () in the Object Browser.
      2. Open Volumetric's properties ().
      3. Select the Basic - Definition page.
      4. Click the ellipsis button in the Volume Grid section.
      5. Select Area Target from the Object List.
      6. Select SimpleCartographic as the Volume Grids for: Area Target option.
      7. Click OK.
      8. View the Simple Cartographic grid in the 3D Graphics window.
  3. Create a Volume Grid to constrain the cartographic reference frame to the sensor field-of-view.Closed
    1. In the Object Browser, right-click on the Area Target () and select Analysis Workbench...
    2. Select the Spatial Analysis tab.
    3. Click the Create new Volume Grid button.
    4. Click the Select... button to choose Constrained as the Component Type.
    5. Click OK on the Component Type window.
    6. Enter a name for the volume grid (e.g. SensorFOV) in the Name field.
    7. If the Parent object is not set to Area Target, click the Select... button and choose the correct parent object.
    8. Click the ellipsis button in the Reference Grid field.
    9. Select Area Target as the Object and select Simple Cartographic as the Volume Grids For: AreaTarget option.
    10. Click the ellipsis button in the Spatial Condition field.
    11. Select the Sensor as the Object and select Visibility as the Spatial Condition For: Sensor.
    12. Click OK to save the volume grid properties and dismiss the Add Spatial Analysis Component window.
    13. Click OK to close the Analysis Workbench.
  4. View the volumetric object with the constrained grid.Closed
    1. Right-click Volumetric () in the Object Browser.
    2. Open Volumetric's properties ().
    3. Select the Basic - Definition page.
    4. Click the ellipsis button in the Volume Grid field and select the Area Target on the left and the constrained volume grid (e.g. SensorFOV) on the right.
    5. Click OK.
    6. Click the ellipsis button in the Spatial Calculation field and select the Area Target on the left and the Altitude on the right.
    7. Click OK.
    8. Click Apply to apply the changes and keep the Properties Browser open.
  5. Compute the Volumetric object.
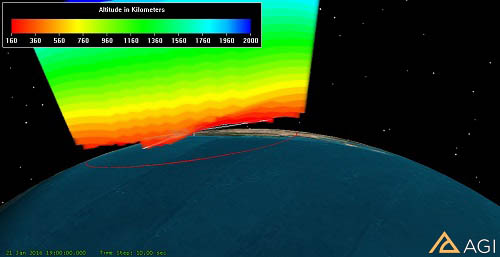
  6. Visualize the Volume Grid between 160 km and 2000 km.Closed
    1. In the Volumetric properties, select the 3D Graphics - Grid page.
    2. Disable the Show Grid option.
    3. Select the 3D Graphics - Volume page.
    4. Enable the Spatial Calculation Levels option.
    5. Click the Insert Evenly Spaced Values... button.
    6. Insert evenly spaced values (e.g. Start: 160, Stop: 2000, Step: 200.
    7. Click the Create Values button.
  7. Display a LegendClosed
    1. Select the 3D Graphics - Legends page.
    2. Enable the Show Legend option.
    3. Click OK.
  8. View the Spatial Calculation levels in the 3D Graphics window.
  9. Generate a Satisfaction Volume report to view the percent satisfied.Closed
    1. Right-click on the Volumetric object and open the Report & Graph Manager.
    2. Generate a Satisfaction Volume report.

There are several example scenarios using Volumetrics on our Resources page.

Volumetrics can import user-supplied data such as weather? Check out this tutorial for more information.

Don't forget to save your work!