Attitude Coverage
STK Professional, STK SatPro, and Coverage.
The results of the tutorial may vary depending on the user settings and data enabled (online operations, terrain server, dynamic Earth data, etc.). It is acceptable to have different results.
Set the Scene
A ship crossing the equator near the South American coast is equipped with a sensor that needs to maintain access to as many GPS satellites as possible. Using Attitude Coverage determine the best direction in which to point the sensor by selecting a direction with the highest minimum amount of satellites to maximize the tracking of the satellites. The sensor will be constrained in order to avoid the sun by at least ten (10) degrees. An Attitude Sphere centered on the ship will be used for visualization of the results.
Create a Scenario
Start by creating a scenario.
- Create a scenario and called Attitude_Cov.
- Set the Start time to 1 Jul 2017 16:00:00.000 UTCG.
- Set the Stop time to 2 Jul 2017 16:00:00.000 UTCG.
Save Often!
Disable Terrain
- Open Attitude_Cov’s (
 ) properties (
 ).
). - Browse to the Basic – Terrain page.
- Disable the Use terrain server for analysis option.
- Click OK.
Insert a Ship
- Insert a Ship (
 ) object using the Insert Default () method.
 - Rename the ship "Destroyer".
- Open Destroyer's () properties ().
- On the Basic - Route page, in the Altitude Reference field, set the Reference to MSL (Mean Sea Level).
Mean Sea Level is the average level of the ocean's surface, calculated as the arithmetical mean of hourly tide levels taken over an extended period and used as the standard for determining terrestrial and atmospheric elevations and ocean depths.
- Click the Insert Point option two times.
- Set the waypoints below:
- Click Apply.
| Latitude | Longitude |
|---|---|
| 5 deg | -95 deg |
| -5 deg | -85 deg |
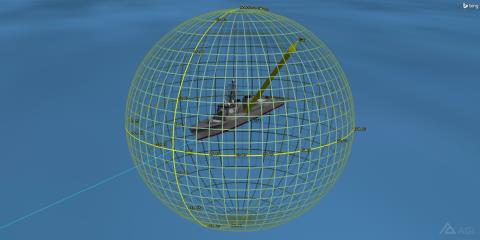
Attitude Sphere
Orient the attitude sphere so that zero (0) degrees longitude is in Destroyer's direction of travel. This can help later on when orienting the sensor when tracking GPS satellites.
- Browse to the 3D Graphics - Attitude Sphere page.
- Enable Show and set the Scale Value to 2.0.
- Click Frame: Select.
- Expand the Installed Components option.
- Set the Axis For to Body (body fixed axis).
- Click Apply.
Add a Sun Vector
A sun vector is useful in visualizing that a sensor attached to Destroyer avoids the sun by at least ten (10) degrees.
- Browse to the 3D Graphics - Vector page.
- Enable Sun Vector - Show.
- Locate the Common Options - Component Size field.
- Set the Scale Relative to Model Size to 2.0.
- Click OK.
- Bring the 3D Graphics window to the front.
- Right-click on the ship () in the Object Browser and select Zoom To.
Attitude Sphere
Attach a Sensor to the Ship
- Use the Insert STK Objects tool to insert a Sensor (
 ) object using the Insert Default () method.
 - Select Destroyer () and click OK.
- Rename the Sensor object () to GPS_Sens.
- Open GPS_Sens's () properties ().
- On the Basic - Definition page, set the Cone Half Angle to 50 deg.
- Open the 3D Graphics - Attributes page.
- Set the Projection % Translucency to 100.
This is done to avoid the sensor cone in the 3D Graphics window, which would interfere with the display of the attitude sphere.
Set the Constraints
- Open the Constraints - Sun page.
- In the Boresight field, enable the Solar Exclusion Angle option.
- Set the value to ten (10) deg.
- Click OK. .
This ensures that GPS_Sens will ignore access to another object if it is within ten (10) degrees of the Sun (exclusion angle is ten (10) degrees).
Model the GPS Network
You need an archived database of satellite TLEs to complete this lesson and to obtain the correct results in any reports or graphs if you are taking the Level 3 Grandmaster Certification. Below are two ways to bring in the archived database. The first way is by bringing in the file via STK. The second way is by downloading a file from AGI. If desired, try both ways for practice.
Download an Archived Satellite Database Using STK
- Open Attitude_Cov’s () properties ().
- Open the Basic – Database page.
- Click the Update Database Files option.
- Enable the Obtain Archived Database option.
- Enable the Specific Database option.
- Select the stkAllTLE option from the pull-down menu.
- Click the Update button.
- When the Information window appears, click OK.
- Close the Update Satellite Database window.
- Close the properties window.
Download an Archived Satellite Database from AGI
If you have access to the Internet from another computer, but not from the computer with STK, complete the following steps:
- Browse to agi.com and LOG IN.
- At the top of the page, click Support.
- Click the Supporting STK Data option.
- Select Satellite Database.
- Select Click here to search the archives.
- Make the following selections:
- Click Get Archive.
| Option | Value |
|---|---|
| Satellite Database: | stkAllTLE |
| Archive Date: | 07/01/2016 |
Insert the GPS Satellites
In the Insert STK Objects tool, insert a Satellite object using the From TLE File method.
If you chose the STK download method, use the following steps to bring in database.
- Browse to C:\ProgramData\AGI\STK 11 (x64)\Databases\Satellite.
- Select stkAllTLE.tce file.
If you chose the AGI download method, use the following steps to bring in the database.
- Browse to the directory where you downloaded the stkAllTLE20160701.tar.gz file.
- Click Open.
Insert the Satellites from the Database
- In the Insert From Satellite Database, set the Common Name to GPS.
- Click Search.
- Select and insert only GPS BIIF / BIIR / BIIRM satellites. There should be 32 selected satellites.
Create a Constellation of Satellites
- Insert a Constellation object (
 ) using the Define Properties () method.
 - In Selection filter: enable Satellite.
- Move (
 ) the selected satellites to the Assigned Objects list.
 - Click OK.
- Rename the Constellation object “GPS_Sats.”
Attitude Coverage
With Destroyer and GPS_Sens in place, you can now track the GPS satellites. Using Attitude Coverage you can determine the most advantageous direction to point the sensor. You are only concerned when a satellite is five (5) degrees above the horizon to ninety (90) degrees above your ship.
- Use the Insert STK Objects tool to insert an Attitude Coverage (
 ) object using the Insert Default () method.
 - When the Select Object window opens, select Destroyer () and click OK.
- Rename the Attitude Coverage object GPSCov.
If you do not see an Attitude Coverage option in the Insert STK Objects tool, click the Edit Preferences... button to add it.
Point Definition Properties
In contrast to point definition in the STK Coverage module, here you are defining the properties of the object pointing, which depends on the directions represented by points on the coverage grid. That object must be a sensor, transmitter, receiver, or radar whose parent object is the one for which Attitude Coverage is being defined.
The basic properties of that object (such as a sensor's field-of-view), including its position at each time step in the coverage interval and any constraints imposed on it, determines the access to the selected assets. These properties are also taken into account in Figure of Merit computations.
- Open GPSCov's () properties ().
- On the Basic - Grid page, set the following Grid Area of Interest options:
- Set the Point Granularity value to ten (10) deg.
- Click Apply.
| Option | Value |
|---|---|
| Type | Latitude Bounds |
| Min Latitude | 5 deg |
| Max Latitude | 90 deg |
If you were doing this operationally, you would probably require a grid with more points. For the purposes of this lesson, the grid contains less points due to the amount of time it would take to compute more points.
View in 3D
Let's take a look at the attitude coverage in the 3D Graphics window.
- Bring the 3D Graphics window to the front.
- Mouse around in the 3D Graphics window to view the attitude coverage.
You can see the grid has been applied from five (5) degrees latitude to ninety (90) degrees latitude every ten (10) degrees.
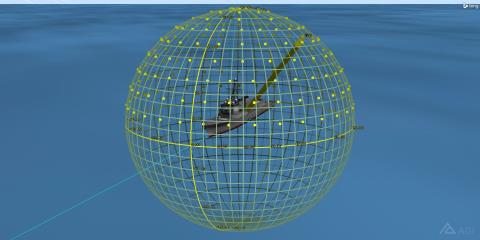
Grid Points
Grid Constraints
GPS_Sens has a ten (10) degree Solar Exclusion Angle constraint which needs to be applied to the grid.
- Return to GPSCov's () properties ().
- On the Basic - Grid page, click the Grid Constraint Options button.
- Enable the Use Object Instance for Constraints option.
- Ensure Object Class: shows Sensor.
- Select Destroyer/GPS_Sens as the Object.
- Click OK.
- When you return to the Basic - Grid page, click Apply.
Assign Assets
Assign coverage assets just as you would if you were computing traditional coverage.
- Browse to the Basic - Assets page.
- In the Assets list, select GPS_Sats.
- Click Assign.
- Click Apply.
Remove Grid Points
Prior to computing coverage, minimize clutter in the attitude sphere by turning off the graphical display of points in the attitude coverage grid.
- Browse to the 3D Graphics - Attributes page.
- Disable Show Points.
- Click OK.
Compute Coverage
- Right-click GPSCov () in the Object Browser.
- Expand (
 ) the AttitudeCoverage menu.
 - Select Compute Accesses.
It may take a few minutes for STK to compute accesses on the attitude sphere.
Attitude Figure Of Merit
Determine the best direction in which to point the sensor in order to maximize access from the sensor to the satellites in the constellation. Add an Attitude Figure Of Merit (FOM) to the Attitutde Coverage object that will define the required quality of coverage.
- Use the Insert STK Objects tool to insert an Attitude Figure Of Merit (
 ) object using the Insert Default () method.
 - When the Select Object window opens, select GPSCov () and click OK.
- Rename the Attitude Figure Of Merit object NAsset.
Number of Assets Coverage
N Asset Coverage measures the number of assets available simultaneously during coverage. You are examining the lowest number of satellites that can be tracked by pointing the sensor at various locations. By selecting the location with the highest minimum, you can maximize tracking of the GPS satellites.
- Open NAsset's () properties ().
- On the Basic - Definition page, make the following changes:
- Click Apply.
| Option | Value |
|---|---|
| Type | N Asset Coverage |
| Compute | Minimum |
Grid Report
Generate a Grid report to determine the highest minimum value. Use this number to create a graphical display of the results in the Attitude Sphere.
- In the Object Browser, right-click on NAsset () and select Report & Graph Manager (
 ).
). - In the Installed Styles list, select the Grid Stats report.
- Click Generate.
- Scroll to the bottom of the report and note the Minimum and Maximum values.
- Close the report and the Report & Graph Manager.
Graphic Contours
You can display coverage contours on the attitude sphere for attitude just as you can on the map and globe for traditional coverage.
- Open NAsset's () properties ().
- Browse to the 3D Graphics - Animation page.
- Disable Show Animation Graphics.
- Click Apply.
- Browse to the 3D Graphics - Static page.
- Change % Translucency to 20.
- Enable Show Contours.
- In the Level Adding field, make the following changes:
- Click Add Levels.
- Make the following Level Attribute changes:
- Click Apply.
- Click the Legend button.
| Option | Value |
|---|---|
| Start | Minimum value from the Grid Stats report (should be zero (0)) |
| Stop | Maximum value from the Grid Stats report (should be three (3)) |
| Step | 1 |
| Option | Value |
|---|---|
| Color Method | Color Ramp |
| Start Color | Red |
| End Color | Blue |
View the Contours
- Bring the 3D Graphics window to the front.
- Use the mouse to zoom out until you can see the entire Attitude Sphere.
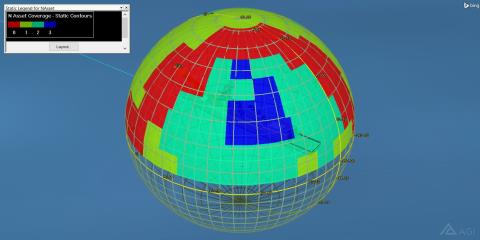
FOM Contours
The blue areas have a coverage level of three (3), i.e. if the sensor is pointed in any direction within that area, it will always have access to at least three satellites. The path in red shows a coverage level of zero (0). This is because of the solar exclusion angle constraint or during the analysis period, no GPS satellites will be visible to the sensor. If you animate, you should be able to see the sun vector trace a path right through most of the red swath.
Value By Point Report
A Value By Point report could be used to point and lock the sensor along the appropriate direction based on your analysis.
- In the Object Browser, right-click on NAsset () and select Report & Graph Manager ().
- In the Installed Styles list, select the Value By Point report.
- Click Generate.
- Scroll through the report. Based on the report, you could choose a latitude and longitude containing a high minimum and point the sensor along that direction.
You have now determined where the most ideal locations would be to aim your sensor boresight under nominal circumstances in order to maximize your tracking of the GPS satellites.
Save Your Scenario!
 Visit AGI.com