Create a Multihop Communication Link
STK Pro, STK Premium (Air), STK Premium (Space), or STK Enterprise
You can obtain the necessary licenses for this training by contacting AGI Support at support@agi.com or 1-800-924-7244.
The results of the tutorial may vary depending on the user settings and data enabled (online operations, terrain server, dynamic Earth data, etc.). It is acceptable to have different results.
Capabilities Covered
This lesson covers the following STK Capabilities:
- STK Pro
- Communications
Problem statement
A ship passing through the Panama Canal Zone needs to transmit data to a ship located in the Strait of Hormuz using two geosynchronous satellites. The entire communication system is analog. Surface units are using Ka-Band (26.5-40 GHz) communications. Satellite to satellite communications are via S-Band (2-4 GHz). The ship transiting the Panama Canal can target its phased array communication antennas at the satellite. Satellite to satellite communications are also targeted via small parabolic antennas. Satellite to surface antennas are fixed and boresighted away from the ships. The ship transiting the Straight of Hormuz can target its parabolic receive antenna at the satellite. Can intelligible data reach the ship transiting the Strait of Hormuz?
Solution
Use STK's Communications capability to model a scenario that analyzes a multi-hop communication link from a ship transiting the Panama Canal Zone to a ship transiting the Strait of Hormuz. Apply STK's radio frequency environmental features to obtain realistic communications analysis.
Video guidance
Watch the following video. Then follow the steps below, which incorporate the systems and missions you work on (sample inputs provided).
Starter scenario
To speed things up and allow you to focus on the portion of this exercise that teaches you build a multi-hop communication system in STK, a partially created scenario has been provided for you.
- Launch STK (
 ).
). - Ensure that the Welcome dialog is visible in the STK Workspace.
- Click the Open a Scenario (
 ) button.
 - Browse to <STK install folder>\Data\Resources\stktraining\VDFs (e.g., C:\Program Files\AGI\STK 12\Data\Resources\stktraining\VDFs).
- Select Comm_MultiHopLink.vdf (
 ).
). - Click .
If using an older version of STK, browse to <STK install folder>\Data\Resources\stktraining\samples\Comm_Retransmit.vdf.
Save a VDF as a SC File
When you open the scenario, a directory with the same name as the scenario will be created in the default user directory (C:\Documents\STK 12. The scenario will not be saved automatically. When you save a scenario in STK, it will save in the format in which it originated. In other words, if you open a VDF, the default save format will be a VDF. The same is true for a scenario file (*.sc). If you want to save a VDF as a SC file (or vice-versa), you must change the file format when you are performing the Save As procedure.
- Open the File menu and select Save As.
- Select STK User on the left side of the Save As window.
- Select Comm_MultiHopLink and click Open.
- Change Save as type: to Scenario Files (*.sc) and click .
- Click to confirm.
Save often!
Communication Link
In the Object Browser, you can see multiple Sensor objects. Think of the Sensor objects as servo motors being used to point a steerable antenna at a specific target. You will attach a Transmitter or Receiver object to a specified Sensor object, which will point the embedded antenna at a target. Prior to beginning the scenario, you can get an overall feel of where each object is located and where the different sensors point.
You'll build the communication link starting where the transmission begins and follow the transmission until it reaches its destination.
Transmission Uplink from the Canal Zone
A communications link exists between Canal_Transit and Geo_West. Canal_Transit is transmitting on a frequency of 30 GHz with a power of 30 dBW. Canal_Transit is employing a phased array transmit antenna. Geo_West is using a 4.6 meter diameter fixed boresight parabolic receiver antenna.
If you look at the 2D and 3D Graphics windows, you can see the satellite’s sensor boresight contour in the canal zone.
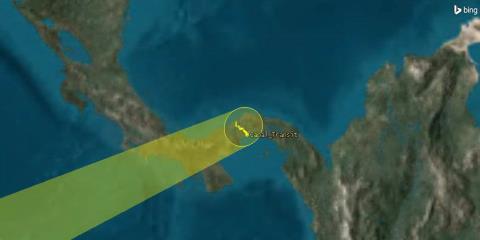
3D Canal Zone boresight
There are many parameters that reflect the quality of a signal, but Bit Error Rate (BER) is typically a good indicator. For this tutorial, we will focus on BER. The lower the BER, the better the quality of the signal.
- Using the Insert STK Objects Tool, insert a Transmitter (
 ) object using the Insert Default () method.
 - In the Select Object window, select Canal_Transit and click .
- Rename the Transmitter object UplinkXmtr.
- Open UplinkXmtr's () properties (
 ).
). - On the Basic - Definition page, change Type: to Complex Transmitter model.
- Under the Model Specs tab, change Frequency to 30 GHz.
- Click .
Model a Phased Array Antenna
- Select the Antenna tab.
- Under the Model Specs tab, change Type: to Phased Array.
- Set the Design Frequency: to 30 GHz.
- Under the Element Configuration tab, change Number of Elements X: and Y: to 7.
- Click .
- Click the Beam Direction Provider tab.
- In the Beam Steering field, select the Enabled checkbox.
- Move (
 ) Geo_West (
 ) to the selected object window.
 - Click .
Analog Retransmission
Re-transmitters can be used to model RF transponders. A scenario with the chain Source Transmitter - Receiver/Re-transmitter - Receiver will model a single-hop RF transponder. Let's start with a receiver.
- Using the Insert STK Objects Tool, insert a Receiver (
 ) object using the Insert Default () method.
 - In the Select Object window, select TgtCanalZone (
 ) and click .
 - Rename the Receiver object UplinkRcvr.
- Open UplinkRcvr's () properties ().
- On the Basic - Definition page, change Type: to Complex Receiver Model.
- Click .
Set the Antenna to Parabolic
- Select the Antenna tab.
- Under the Model Specs tab, change Type: to Parabolic.
- Set the Design Frequency: to 30 GHz.
- Change the Diameter: to 4.6 m (meters).
- Click .
Simple Link Budget
At this time, you can quickly create a simple link budget between the ship and the satellite.
- In the Object Browser, right-click on UplinkRcvr () and select Access (
 ).
). - In the Associated Objects List, expand Canal_Transit (
 ) and select UplinkXmtr ().
 - In the Reports field, click .
- In the Link Budget report, scroll to the right until you locate the BER (Bit Error Rate) column.
For the purposes of this scenario, a BER of 1.000000e-007 or lower is considered good.
Overall, the communication uplink from the ship to the satellite appears good. The ship is moving and the satellite has a small inclination. BERs are steady. C/N (dB) (carrier to noise ratio) and Eb/No (dB) (energy per bit to noise power spectral density ratio) have slight deviations. Since the satellite receive antenna's boresight is fixed, this is the most likely reason for any fluctuations.
View in 2D
- Bring the 2D Graphics window to the front and manually zoom to the Panama Canal.
- Click the Reset (
 ) button.
 - Adjust the Time Step: to 60.00 sec by increasing (
 ) or decreasing (
 ) the speed of the animation.
 - Click the Start (
 ) button and watch as the ship moves through the canal and the boresight moves due to the satellite inclination.
 - When you are finished, return to the Animation Tool and click the Reset () button.
- Close the report and the Access Tool.
You can see the ship getting ready to enter the canal. The small X in the center of the sensor contour is the parabolic antenna's boresight.
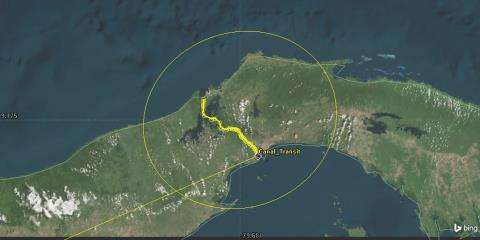
2D View of Ship and Antenna boresight
Geo_West Retransmitter
Retransmit the signal to Geo_East using a complex retransmitter model.
- Using the Insert STK Objects Tool, insert a Transmitter () object using the Insert Default () method.
- In the Select Object window, select Tgt_Geo_East () and click .
- Rename the Transmitter object Geo_West_ReXmtr.
- Open Geo_West_ReXmtr 's () properties ().
- On the Basic - Definition page, change Type: to Complex Re-Transmitter Model.
- Change Sat. Power: to 30 W (30 Watts).
- Change Sat. Flux Density: to -120 dBW/m^2.
- Click .
The Saturation Flux Density (SFD) is the amplifier's saturation point in terms of the input flux density in dBW/m2. This represents the per carrier flux density for systems supporting multiple carriers per transmitter. It is a measure for the sensitivity of the input of the transponder. A lower SFD value makes the input of the transponder more sensitive and requires less uplink power from the uplink station. Increasing the sensitivity in the transponder allows the introduction of more noise into the system, due to the higher sensitivity.
Ensure the Antenna is set to Gaussian
- Select the Antenna tab.
- Keep the Gaussian type.
- Set the Design Frequency: to 4 GHz.
- Change the Diameter: two (2) meters.
- Click .
- Select the Transfer Functions tab.
- Change the Index 0 Coefficient to -2.6e+010.
- Click .
Frequency coefficients specify the transmitted frequency as a function of the received frequency. They can only be entered in polynomial form. The coefficient order is displayed in the left column of the table and updates automatically as coefficients are added or removed. Input and output units are in Hz. The default coefficients of -7e+008 and 1.0 are used to model a 700 MHz down conversion.
The retransmitter is transmitting on a frequency of 4.0 GHz.
Geo_East Receiver
Continue the link by attaching a receiver to Geo_East. You can somewhat simplify this process by reusing the Receiver object attached to Geo_West.
- In the Object Browser, select UplinkRcvr () and click the Copy (
 ) button.
 - Select Tgt_Geo_West () and click the Paste (
 ) button.
 - Expand Tgt_Geo_West () and rename UplinkRcvr1 "Geo_East_Rcvr".
- Open Geo_East_Rcvr's () properties ().
- On the Basic - Definition page, select the Antenna tab.
- Set the Design Frequency: to 4 GHz.
- Change the Diameter: two (2) meters .
- Click .
Bent Pipe Architecture
Data is transmitted to the Geo_West, which retransmits it to Geo_East like a bent pipe. The only processing performed is to retransmit the signal. Any signal degradation is passed on to the next receiver. Analyze the reception at Geo_East using a bent pipe report. To generate a bent pipe link budget in STK, you need to use a Chain object.
- Using the Insert STK Objects Tool, insert a Chain (
 ) object using the Insert Default () method.
 - Rename the Chain object AnalogLink.
- Open AnalogLink's () properties ().
- On the Basic - Definition page, move the following objects from the Available Objects list to the Assigned Objects list in the order shown. This will represent the sequence of uplink to downlink.
- UplinkXmtr
- UplinkRcvr
- Geo_West_ReXmtr
- Geo_East_Rcvr
- Click .
- Bring the 2D Graphics window to the front and zoom out so that you can see the Panama Canal and both satellites.
You need to determine the signal quality for the whole system from Canal_Transit to Geo_East. A chain allows you to calculate multi-hop links in a defined sequence and treat them as single access. When you build a chain, every link in the chain must be met in order for access to be valid. Just like a real chain, if any link fails, the entire chain is broken.
You can see the link created from Canal_Transit to Geo_East via Geo_West.
![]()
2D View of Analog Link Between Canal_Transit and Geo_East
Bent Pipe Report
You need to determine the quality of each chain link. To do that, you will run a Bent Pipe report.
- In the Object Browser, right-click on AnalogLink () and select Report & Graph Manager (
 ).
). - In the Styles field, select the Show Reports checkbox and clear the Show Graphs checkbox.
- Expand Installed Styles if needed to see all the available reports.
- In Installed Styles, select the Bent Pipe Comm Link report and click .
- Using the Bent Pipe Report, answer the following:
- What is the uplink received frequency?
- What is the cross link received frequency?
- Close the report and the Report & Graph Manager.
Look at the first transmission in the report. The report contains link performance data for the uplink (first line), the link from Geo_West to Geo_East (second line), and the combined link (third line). Degradation in retransmitted signal and the composite link performance can readily be perceived. For example, Bit Error Rate (BER) is 1 x 10‐30 in the uplink, ~ 9.9 x 10‐18 in the cross link, and ~ 9.3 x 10‐17 in the composite link.
Changing the frequency coefficient to -2.6e+010 dropped the cross link retransmit frequency to four (4) GHz.
Complete the Link
Geo_East will retransmit the data to Hormuz_Transit.
- In the Object Browser, copy Geo_West_ReXmtr () and paste it to TgtHormuz ().
- Expand TgtHormuz () and rename Geo_West_ReXmtr1 "Geo_East_ReXmtr".
- Open Geo_East_ReXmtr's () properties ().
- On the Basic - Definition page, select the Antenna tab.
- Under the Model Specs tab, change Type: to Parabolic.
- Set the Design Frequency: to 3.5 GHz.
- Change the Diameter: to 4.6 meters.
- Click .
- Select the Transfer Functions tab.
- Change the Index 0 Coefficient to -5e+08.
- Click .
Hormuz_Transit's receiver completes the link.
Create a Downlink Receiver
- In the Object Browser select Geo_East_Rcvr and click the Copy () button.
- Select TgtEastSat () and click the Paste () button.
- Expand TgtEastSat () and rename Geo_East_Rcvr1 "DownlinkRcvr".
Custom Multi-hop Report
The standard bent pipe report analyzes the uplink and downlink. You need a report that adds the transfer between the satellites.
- Using the Insert STK Objects Tool, insert a Chain () object using the Insert Default () method.
- Rename the Chain object "MultiHopLink".
- Open MultiHopLink's () properties.
- On the Basic - Definition page, move the following objects from the Available Objects list to the Assigned Objects list in the order shown.
- UplinkXmtr
- UplinkRcvr
- Geo_West_ReXmtr
- Geo_East_Rcvr
- Geo_East_ReXmtr
- DownlinkRcvr
- Click .
- In the Object Browser, disable AnalogLink ().
- Bring the 2D Graphics window to the front and zoom out so that you can see the Panama Canal, both satellites and the Strait of Hormuz.
You can now see the completed link.
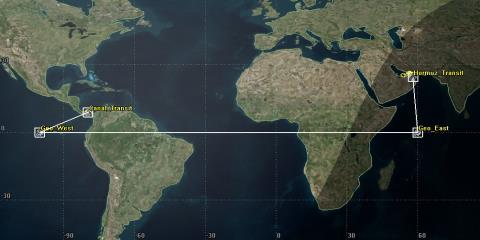
2D Completed Link
Add a Line to the Custom Report
By default, STK only handles two links in reports. This means you will have to create a unique report that will model the full communication link from Canal_Transit to Hormuz_Transit. You need to show the BER total for all three links. Let’s do that by adding another line to your report.
- Right-click on MultiHopLink () in the Object Browser and select Report & Graph Manager.
- Right-click on Bent Pipe Comm Link in the Installed Styles directory and select Properties.
- In the Report Contents field, select Link Information-BER2.
- Click .
- Select Line 3.
- In the Data Providers field, expand the Link Information data provider.
- Add the following items, in order, to Line 3 in the Report Contents window:
- Xmtr Power3
- Xmtr Gain3
- EIRP3
- Prop Loss3
- Rcvd. Frequency3
- Rcvd. Iso Power3
- Flux Density3
- g/T3
- C/No3
- Bandwidth3
- C/N3
- Eb/No3
- BER 3
Change Report Values to Scientific Notation
Changing the BER to scientific notation allows you to look at the significant digits and the exponent of 10, which is what is shown on the other two lines.
- Select Link Information - BER3 in the Report Contents window.
- Click .
- Set the Notation to Scientific (e).
- Click .
- Select Line 4 in the Report Contents window and click .
Add a Line for the Composite Values
Add a new line that will show the composite values of the entire communications link.
- Return to the Report Contents window and select Link Information-BER3.
- Click .
- Select Line four (4).
- From the Data Providers window, add the following items, in order, to Line 4 in the Report Contents window:
- IBO3
- OBO3
- C/No Tot.3
- C/N Tot.3
- Eb/No Tot.3
- BER Tot.3
Set the Report Value to Scientific Notation
- Select Link Information - BER Tot.3 in the Report Contents window.
- Click .
- Set the Notation to Scientific (e).
- Click to close the Options window.
- Click to accept the custom report's property changes.
- Click to close the Warning window.
- In the Styles list, expand the My Styles folder.
- Rename the new report "Multi Hop Link."
- Generate the new report.
- While looking at the composite BERs scroll through the report.
- Are there any fluctuations in the values?
- Close the Report & Graph Manager.
- Keep the report open.
Look at the first four lines in the report. The report contains link performance data for the uplink (first line), the link from Geo_West to Geo_East (second line), the link from Geo_East to Hormuz_Transit (third line), and the combined link (fourth line). Degradation in retransmitted signal and the composite link performance can readily be perceived.
Radio Frequency (RF) Environment
Based on the results of the custom report, the composite BERs are acceptable. The problem is that rain and atmospheric absorption weren't taken into account in the analysis.
- Open Comm_MultiHopLink's (
 ) properties ().
 - Browse to the RF - Environment page.
- Select the Rain & Cloud & Fog tab.
- In the Rain Model field, select the Use checkbox and select the installed ITU model.
- Select the Atmospheric Absorption tab.
- Select the Use checkbox and select the installed ITU model.
- Click .
- Click OK to close Comm_MultiHopLink's () properties.
- Refresh the custom report.
- Scroll all the way to the right side of the report and look at the BER column.
- Keep the report open.
How are the composite BERs? It's obvious that adding RF environment to the analysis had a major impact to the link budget.
As you can see, the BER had a dramatic increase during the initial transmission between Canal_Transit and Geo_West.
Detailed Link Budget
You can check how much rain and atmospheric absorption is affecting your link by creating a detailed link budget.
- In the Object Browser, right-click on UplinkXmtr () and select Access ().
- In the Access Tool Associated Objects List, select UplinkRcvr ().
- Click .
- In Installed Styles, select the Link Budget - Detailed report and click .
- In the report, scroll to the right until you locate the Atmos Loss (dB) and Rain Loss (dB) columns.
- Close the Link Budget - Detailed report, the Report & Graph Manager and the Access Tool.
- Keep the Multi Hop Link report open.
As you can see, rain loss is impacting the link budget.
Adjust the Power
Canal_Transit's transmitter has adjustable power output from 10 through 50 dBW. Currently you are using 30 dBW. Increase the power output.
- In the Object Browser, open UplinkXmtr's () properties ().
- On the Basic - Definition page, change Power: to 40 dBW.
- Click .
- Refresh the Multi Hop Link report.
- Look at the composite BER.
- Return to UplinkXmtr's () properties ().
- Change Power: to 50 dBW.
- Click .
- Refresh the report.
The composite BER is still too high.
There is a noticeable decrease in the composite BER, but they are still too high. The power output has been maximized.
Adjust the Data Rate
STK's Transmitter object's data rate defaults to 16 Mb/sec. Canal_Transit's transmitter has adjustable data rate capability.
- Return to UplinkXmtr's () properties ().
- On the Basic - Definition page, change Data Rate: to 5 Mb/sec.
- Click .
- Refresh the report.
- Look at the composite BER.
- Return to UplinkXmtr's () properties ().
- On the Basic - Definition page, change Data Rate: to one (1) Mb/sec.
- Click .
- Refresh the report.
- Look at the composite BER.
Again, the BERs have decreased but they are still too high.
Scroll through the composite BER column. There are fluctuations, but you can see that there are times that data transmissions will get through at an acceptable level. Both satellites have small inclinations in their orbits, and both ships are moving.
On your own, you can adjust power and data rates to see what effect the different combinations have on the link budget. For instance, you could decrease power and data rate.
SAVE YOUR WORK!