STK Pro, STK Premium (Air), STK Premium (Space), or STK Enterprise
You can obtain the necessary licenses for this tutorial by contacting AGI Support at support@agi.com or 1-800-924-7244.
The results of the tutorial may vary depending on the user settings and data enabled (online operations, terrain server, dynamic Earth data, etc.). It is acceptable to have different results.
Capabilities covered
This lesson covers the following capabilities of the Ansys Systems Tool Kit® (STK®) digital mission engineering software:
- STK Pro
- Analysis Workbench
Problem statement
Analysts, engineers, and mission planners need to constrain access, alter object behavior, and build compound data products that produce different types of output in new ways. You want to calculate the amount of fuel used on a cross-country flight. You know the fuel consumption rate of the aircraft, but you need to calculate both the flight time and the amount of fuel used. You also want to calculate when the fuel quantity reaches a specified amount.
Solution
Use the Analysis Workbench capability's Calculation tool and various types of Calculation components to estimate the amount of fuel consumed during the flight and create a custom condition to model when the fuel quantity reaches a specified amount.
What you will learn
In this tutorial, you will come to understand how to do the following:
- Use the Calculation tool
- Create various types of Calculation components
- Create custom calculations and reportable conditions
Creating a new scenario
First, you must create a new scenario, and then build from there.
- Launch the STK application (
 ).
). - Click
 Create a Scenario in the Welcome to STK dialog box.
 - Enter the following in the STK: New Scenario Wizard:
- Click when you finish.
- Click Save (
 ) when the scenario loads.
 - Verify the scenario name and location in the Save As dialog box.
- Click .
| Option | Value |
|---|---|
| Name | AWB_Fuel_Calculations |
| Location | Default |
| Start | 31 Jul 2026 16:00:00.000 UTCG |
| Stop | + 1 day |
The STK application creates a folder with the same name as your scenario for you.
Save () often during this scenario!
Disabling streaming terrain
By default, the STK application connects to the Ansys Geospatial Data Cloud to distribute Earth terrain data for analysis and visualization. Turn off
- Right-click on AWB_Fuel_Calculations () in the Object Browser.
- Select Properties (
 ) in the shortcut menu.
 - Select the Basic - Terrain page when the Properties Browser opens.
- Clear the Use terrain server for analysis check box in the Terrain Server panel.
- Click to confirm your change and to close the Properties Browser.
Inserting the cities
Your aircraft is flying from Philadelphia, Pennsylvania, to Denver, Colorado. Insert these cities' locations with two
Inserting Philadelphia
Insert Philadelphia as your first Place object using the
- Bring the Insert Object (
 ) tool to the front.
 - Select Place (
 ) in the Select An Object To Be Inserted list.
 - Select From City Database (
 ) in the Select A Method list.
 - Click .
- Enter Philadelphia in the Name field when the Search Standard Object Data dialog box opens.
- Click .
- Select Philadelphia - Pennsylvania in the Results list.
- Click .
Inserting Denver
Next, insert Denver as another Place object.
- Enter Denver in the Name field.
- Click .
- Select Denver - Colorado in the Results list.
- Click .
- Click to close the Search Standard Object Data dialog box.
While you could insert those cities' airports using the
Modeling the flight route
Model the flight route from Philadelphia to Denver.
Inserting an Aircraft object
Add an
- Bring the Insert Object () tool to the front.
- Insert an Aircraft (
 ) object using the Insert Default () method.
 - Right-click on Aircraft1 () in the Object Browser.
- Select Rename in the shortcut menu.
- Rename Aircraft1 () PHL_to_DEN.
Creating a flight route using the Great Arc Propagator
The Great Arc Propagator defines the route of a vehicle that follows a point-by-point path along, over, or below the surface of the Earth at a given altitude or depth. A great arc path, which lies in a plane that intersects the center of the Earth, connects the waypoints.
- Open PHL_to_DEN's () Properties ().
- Select the Basic - Route page when the Properties Browser opens.
- Note that the default propagator is set to GreatArc.
Inserting the route's waypoints
The waypoints that comprise the great arc route are contained in a table that displays each point, along with all of its properties, in sequence. You can use the table to directly edit those properties. One row of values describes a single waypoint in the route of the vehicle. Enter the two waypoints manually using the coordinates of the two Place objects you inserted earlier.
- Click .
- Enter the following values for the first waypoint by clicking in the associated cell:
- Select the Enter key.
- Click again.
- Enter the following for the second waypoint:
- Select the Enter key.
- Click to confirm your changes and to close the Properties Browser.
| Option | Value |
|---|---|
| Latitude | 39.95 deg |
| Longitude | -75.16 deg |
| Option | Value |
|---|---|
| Latitude | 39.74 deg |
| Longitude | -104.99 deg |
Viewing the flight route
View the flight route in the 2D Graphics window.
- Bring the 2D Graphics window to the front.
- Click Zoom In (
 ) on the 2D Window Defaults toolbar.
 - Hold down the left mouse button and drag your cursor across the area of the 2D Graphics window so that you can see the flight route between Philadelphia () and Denver ().
- Release your left mouse button.
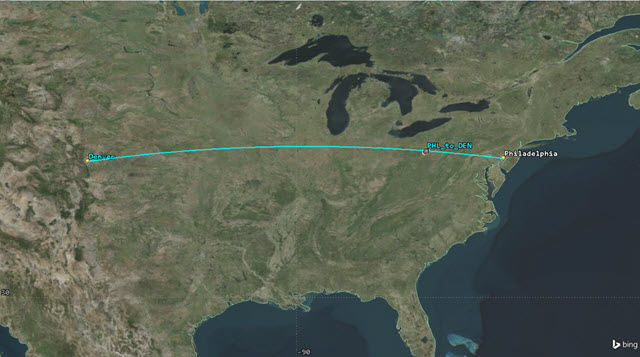
Flight ROUTE from Philadelphia to Denver
Using the Calculation tool
The Analysis Workbench capability comprises four application-wide tools (the Vector Geometry tool, the Time tool, the Calculation tool, and the Spatial Analysis tool) that you can use to create custom components and insert them into your scenarios. They are designed to streamline, organize, and extend the fundamental computational capabilities of the STK software. You can use these tools to create components that suit your needs. The Calculation tool defines components that produce time-varying computational results that can be reported, graphed, transformed, and analyzed further. Types of calculations include Scalars ( ), Conditions (
 ), and Parameter Sets (
 ).
).
While you could use the
Opening the Calculation tool
Open the Calculation tool from the Analysis Workbench.
- Right-click on PHL_to_DEN () in the Object Browser.
- Select Analysis Workbench... (
 ) in the shortcut menu.
 - Select the Calculation tab when the Analysis Workbench opens.
Creating a constant scalar
Begin by specifying a simple Scalar component to define a constant rate of fuel usage for the aircraft — roughly two pounds per second for an airliner at cruising speed.
- Click Create new Scalar Calculation () on the Calculation toolbar.
- Click Type: when the Add Calculation Component dialog box opens.
- Select Constant () in the Select Component Type list when the Select Component Type dialog box opens.
- Click to confirm your selection and to close the Select Component Type dialog box.
- Enter FuelFlowRate in the Name field.
- Open the Dimension drop-down list.
- Select Mass Per Time.
- Enter 2 lb/sec in the Constant Value field.
- Click to confirm your changes and to close the Add Calculation Component dialog box.
This type will produce an explicitly specified constant of a certain dimension and unit.
Creating a scalar calculation from a data element
To determine how long the aircraft has been in flight, create a new Scalar component to use with an existing Aircraft data provider.
- Click Create new Scalar Calculation () on the Calculation toolbar to create another scalar calculation.
- Click Type: when the Add Calculation Component dialog box opens.
- Select Data Element () in the Select Component Type list when the Select Component Type dialog box opens.
- Click to confirm your selection and to close the Select Component Type dialog box.
- Enter FlightDuration in the Name field.
- Expand (
 ) the Distance () data provider in the Select Data Element list.
 - Select the Time from start (
 ) data provider element.
 - Click to confirm your changes and to close the Add Calculation Component dialog box.
This type lists every scalar time-varying element from the STK data provider system, which allows you to take advantage of an existing computational output from the STK application and incorporate it into a new framework within the Calculation tool.
The
This is the time elapsed from the first waypoint time.
Generating a FlightDuration report
All components from the Calculation tool have on-the-spot reporting options that enable you to generate reports and graphs using all of the relevant information from the selected component without first having to create a new style.
- Right-click on FlightDuration (), located in the My Components (
 ) folder, in the Components for: PHL_to_DEN tree.
 - Select Report/Graph... in the shortcut menu.
- Ensure Report is selected in the Type list, located in the Report/Graphs Details panel, when the Calculation Report/Graph dialog box opens.
- Click .
- Review the FlightDuration report.
- Close the FlightDuration report when finished.
- Click to close the Calculation Report/Graph dialog box.
Note the total duration of your flight, measured in seconds.
Creating a scalar function
Create another Scalar component, this time using a function to calculate the estimated amount of fuel used over time using the two Scalar components you created earlier.
- Click Create new Scalar Calculation () on the Calculation toolbar to create a third scalar calculation.
- Click Type: when the Add Calculation Component dialog box opens.
- Select Function(x,y) () in the Select Component Type list when the Select Component Type dialog box opens.
- Click to confirm your selection and to close the Select Component Type dialog box.
- Enter FuelUsed in the Name field.
This will allow you to create a Scalar function with two arguments, x and y. The resulting calculation can inherit its dimension from argument x or argument y, or can have a dimension assigned explicitly.
Selecting the value function
Choose a value function to be evaluated. There are several types of functions available: plus (a*x+b*y), minus (a*x-b*y), multiply (a*x*y), divide (a*x/y), and linear (a*x^2+b*x*y+c*y^2). Since the amount of fuel used is a function of the rate in kilograms per second over time, use a multiply function.
- Open the Function drop-down list.
- Select a*x*y.
Setting the function's arguments
You must select the arguments to be used by the function and its coefficients.
- Click the x ellipsis (
 ) in the Arguments panel.
 - Select FuelFlowRate () in the Scalar Calculations for: PHL_to_DEN tree when Select Reference Scalar Calculation dialog box opens.
- Click to confirm your selection and to close the Select Reference Scalar Calculation dialog box.
- Click the y ellipsis () in the Arguments panel.
- Select FlightDuration (
 ) in the Scalar Calculations for: PHL_to_DEN tree when Select Reference Scalar Calculation dialog box opens.
 - Click to confirm your selection and to close the Select Reference Scalar Calculation dialog box.
- Leave a set to 1 in the Coefficients panel.
Note that the internal units for the arguments are used in the function; the Analysis Workbench does not allow you to specify units for its computations.
Choosing the function's outputs
Select the dimension of the calculated value. When computed, the STK application creates a function with the inputs listed under Arguments, returning the values computed by the value function.
- Leave Inherit Dimension set to No in the Outputs panel.
- Open the Dimension drop-down list.
- Select Mass.
- Note the Unit defaults to kg.
- Click to confirm your changes and to close the Add Calculation Component dialog box.
You can choose whether the function's output inherits its dimension from the x or y argument or using a custom dimension of your choosing.
You are using pounds per second. A conversion will automatically take place in the Analysis Workbench.
Generating a FuelUsed graph
Generate a graph based on your scalar function.
- Right-click on FuelUsed (), located in the My Components () folder, in the Components for: PHL_to_DEN tree.
- Select Report/Graph... in the shortcut menu.
- Open the Type drop-down list in the Report/Graphs Details panel when the Calculation Report/Graph dialog box opens.
- Select Graph.
- Click .
- Review the results.
- Close the Fuel Used graph when finished.
- Click to close the Calculation Report/Graph dialog box.
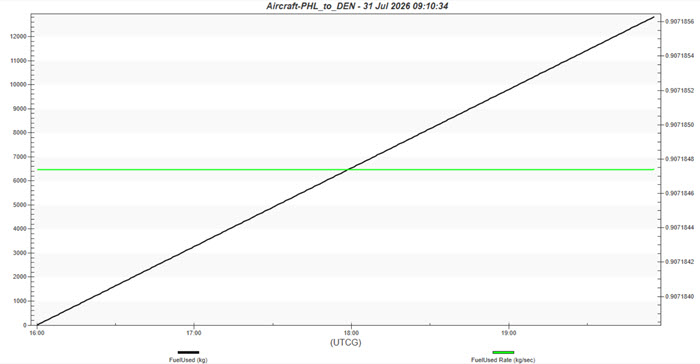
Fuel Used graph
As expected, the amount of fuel used increases linearly with time.
Creating a Condition
A Condition component defines a scalar calculation that is considered to be satisfied when it is positive and not satisfied when it is negative. Create a Condition component to report when a certain amount of fuel has been used. The result of the Condition will be a set of Time components that define when the satisfaction criteria are met.
- Click Create new Condition (
 ) on the Calculation toolbar.
 - Ensure the Type is set to Scalar Bounds when the Add Calculation Component dialog box opens.
- Enter SpecificFuelQuantity in the Name field.
- Click the Scalar ellipsis ().
- Select FuelUsed () in the Scalar Calculations for: PHL_to_DEN tree when Select Reference Scalar Calculation dialog box opens.
- Click to confirm your selection and to close the Select Reference Scalar Calculation dialog box.
- Leave the Operation set to Above Minimum.
- Enter 10000 lb in the Minimum field.
- Click to confirm your changes and to close the Add Calculation Component dialog box.
The default Calculation type is Scalar Bounds. Scalar Bounds define a condition by combining a specified Scalar component with scalar bounds.
The bounds are defined by min and/or max values and the associated operation. The resulting Time components will show when the amount of fuel used exceeds 10,000 pounds.
Generating a SpecificFuelQuantity report
Generate a report that returns the time when the condition's satisfaction threshold is crossed — that is, when over 10,000 pounds of fuel is used.
- Expand () SpecificFuelQuantity () in the Components for: PHL_to_DEN tree.
- Right click on the InCrossingTimes (
 ) Time Array.
 - Select Report... in the shortcut menu.
- Note the Time when the SpecificFuelQuantity report opens.
A Time Array is a time component that produces intervals of time, within which there are ordered arrays of times.
This report shows the precise moment in time when the flight crosses the 10000 pound fuel usage threshold.
Saving your work
Clean up and close out your scenario.
- Close any open reports, tools, and the Analysis Workbench.
- Save () your work.
Summary
You began by building a simple, notional flight route between two cities using an Aircraft object and the Great Arc propagator. You then used the Analysis Workbench capability's Calculation tool to build two Scalar components and a scalar function. You then created a Condition component for that function and used it to create a specific fuel quantity report based on a related Time Array component. Using the Calculation tool, you can create components that can be used to constrain access, alter object behavior, and build compound data products that produce different types of output in a new way.