STK Pro, STK Premium (Air), STK Premium (Space), or STK Enterprise
You can obtain the necessary licenses for this tutorial by contacting AGI Support at support@agi.com or 1-800-924-7244.
The results of the tutorial may vary depending on the user settings and data enabled (online operations, terrain server, dynamic Earth data, etc.). It is acceptable to have different results.
Capabilities covered
This lesson covers the following capabilities of the Ansys Systems Tool Kit® (STK®) digital mission engineering software:
- STK Pro
- Analysis Workbench
Problem statement
Engineers and analysts want to analyze post-flight and post-operation telemetry data from a test. The data are critical to help understand behaviors of a vehicle and its subsystems. You have telemetry data available from external sources, but you must format it in such a way that they are usable by the STK application for visualization and analysis purposes.
Solution
Extend your analysis and reporting capabilities by configuring the external data files so they can be read by the STK application to provide reference data for a scenario object. First, create an External Data file and modify it with a simple text editor so it can be read by the STK application. Then, import it using a Connect command to read the data into the STK application, which will associate it with an STK object and a particular data provider. Next, create and edit a Calculation Scalar file and use it with the STK software's Analysis Workbench capability to associate it with another data provider. Once imported, use each file to create custom dynamic data displays.
What you will learn
Upon completion of this tutorial, you will understand:
- How to create and format External Data files and Calculation Scalar files
- How to import data from External Data files using Connect commands
- How to import data from Calculation Scalar files using the Analysis Workbench capability
- How to create custom data displays using the User Supplied Data and Scalar Calculations data providers
Creating a new scenario
First, you must create a new STK scenario, then build from there.
- Launch the STK application (
 ).
). - Click
 Create a Scenario in the Welcome to STK dialog box.
 - Enter the following in the STK: New Scenario Wizard:
- Click when you finish.
- Click Save (
 ) when the scenario loads.
 - Verify the scenario name and location in the Save As dialog box.
- Click .
| Option | Value |
|---|---|
| Name | External_Data_Test |
| Location | Default |
| Start | Default date / time 16:00:00.000 UTCG |
| Stop | + 24 hr |
The STK software creates a folder with the same name as your scenario for you.
Save () often during this lesson!
Inserting a Satellite object
Insert a notional Satellite object using the Orbit Wizard method.
- Bring the Insert STK Objects tool (
 ) to the front.
 - Select Satellite (
 ) in the Select An Object to Be Inserted list.
 - Select Orbit Wizard (
 ) in the Select A Method list.
 - Click .
- Leave the Type set to Circular.
- Enter TestSat in the Satellite Name field when the Orbit Wizard opens.
- Leave all other values set to their defaults.
- Click to propagate TestSat () and to close the Orbit wizard.
Creating an External Data file
An External Data file is an ASCII text file formatted for compatibility with the STK application that ends in a *.txt extension. External Data files contain time-ordered object data computed outside of the STK application.
The data contained in an External Data file must be arranged in blocks called keyword groups. A keyword group starts with BEGIN <group name> and ends with END <group name>. The information contained in the block consists of keywords their associated values, which are called keyword phrases. Keywords are not case sensitive, and their associated values can be separated by a single or several spaces or tabs.
The keyword groups in External Data files are further organized into data groups and the data elements to ensure that the data contained in the file can be read by the STK application. A
The data files used in this tutorial represent telemetry data that would come from an external source. They contain notional data not associated with any real satellite. They're used to show you how to format and insert your data when working with the STK application.
Copying the contents of an External Data file
Copy the contents of a sample External Data file and paste it into the text editor of your choice.
- Open Windows Notepad, Notepad++, TextPad, or another text editor that does not add hidden characters to your text.
- Copy the External Data file sample text below:
- Paste the text into your text editor.
stk.v.4.3
Begin DataGroup
	GroupName           My Data
	NumberOfPoints      3
	BlockFactor         50
	ReferenceEpoch      1 Jan 2001 00:00:00.000000000
	Begin DataElement
		Name          bippy
		Dimension     DistanceUnit
		FileUnitAbbr  km
		InterpOrder   1
	End DataElement
	Begin DataElement
		Name          zippy
		Dimension     Rate
		FileUnitAbbr  ft
		FileUnitAbbr  min
		InterpOrder   1
	End DataElement

	Begin Data
		0.00000000000000e+00  5.03930000000000e+04  1000
		1.20000000000000e+02  4.84840000000000e+04  2000
		2.40000000000000e+02  3.23230000000000e+04  3000
	End Data
End DataGroup
Reviewing the External Data file's contents
Take a look at the contents of the External Data file.
- Review the version stamp.
- Review the keyword phrases at the beginning of the file.
GroupName— the name of the data grouping; it is used to set data through Connect and becomes the data provider group name in the ExternalData data provider for reporting and graphingNumberOfPoints— the number of time-ordered entries in the data table; in this case, there are threeBlockFactorMemory— the number of blocks allocated for reading data. It is used to optimize the performance of sending in data through Connect. In this case, there are 50ReferenceEpoch— the reference epoch for times in the data table. Times are given as seconds past the reference epoch- Review the
DataElementkeyword blocks. - Note each data element's
Dimensionkeyword phrase. - Review each data element's
FileUnitAbbr(file unit abbreviation) keyword phrase. - Review each data element's
InterpOrderkeyword phrase. - Review the
Datakeyword group.
External Data files, like other external file formats, must contain a version stamp. A version stamp indicates the version of the STK software for which the file is formatted to be used. Files can be created in, and imported to, versions of the STK software consistent with the file version stamp or higher. For example, a file created in and stamped with
stk.v.4.3, as here, be imported into version 4.3 of the STK software through the most recent version. The version stamp must be the first line in the External Data file.
You have two data elements: bippy and zippy.
Note that the dimensions for bippy and zippy are DistanceUnit and Rate, respectively. A Dimension is the name of a group of units of the same measure for the particular data element. It controls the allowed unit conversions. DistanceUnit is a simple dimension. Rate is a compound dimension, which is built from simple dimensions. The specification of the dimension must precede the specification of the dimension's units. See the
In the STK application, FileUnitAbbr is the abbreviation of the unit designation specifying the units in which data are input for each dimension. For input dimensions that are a compound dimension, such as Rate, the abbreviations are supplied for each sub-dimension. By default, the STK application assumes that all distance measurements in a data table are in meters and rate measurements are kilometers per second. Your input data are specified to be in measured in kilometers for the Distance and feet per minute for the Rate. See the
Whenever derivative information is not available, the STK application resorts to numerical differentiation. The STK application derives the function and its first derivative based on sampled data, using polynomial interpolation. InterpOrder is the order of Lagrange interpolation to be used to provide values at times not specified in the data table.
Time-ordered data are specified in this block. You have three data points each for three columns of data: time (in epoch seconds past the reference epoch), distance (in kilometers), and rate (in feet per minute).
Copying the satellite's orbit epoch
Update the file's reference to match that of your satellite.
- Return to the STK application.
- Right-click on TestSat () in the Object Browser.
- Select Properties (
 ) in the shortcut menu.
 - Select the Basic - Orbit page when the Properties Browser opens.
- Locate the Orbit Epoch field.
- Copy the Orbit Epoch time (for example, 01 Jun 2026 16:00:00.000 UTCG).
- Click to close the Properties Browser without making any changes.
Updating the External Data file's reference epoch
You need update the file's reference to match that of your satellite. It is important to note that the times in the data file are given as seconds past the reference epoch.
- Return to your text editor.
- Replace the
ReferenceEpoch's associated value with the Orbit Epoch time from TestSat. - Delete the
UTCGunit label.
Your file's ReferenceEpoch keyword phrase should look like the example below:
ReferenceEpoch 1 Jun 2026 16:00:00.000
Updating the External Data file's DataElement names
The file contains two data elements: bippy and zippy. The names of these elements will appear as the data element names in the STK application. Update them to be easier to understand.
- Replace
bippywithDistance. - Replace
zippywithRate.
These names will appear, along with Time, in the My Data data provider group in the Report & Graph Manager.
Your finished External Data File should appear similar to the one shown below:
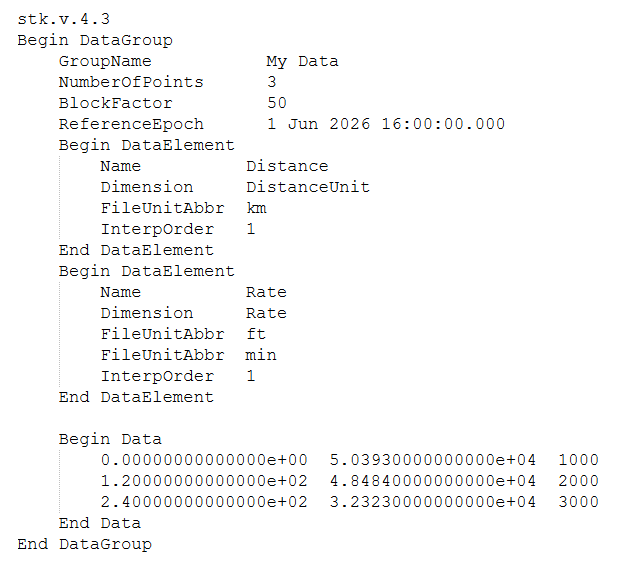
Edited External Data File
Saving the External Data file
Save your External Data file as a text (*.txt) document.
- Open the File menu.
- Select Save As.
- Browse to your scenario folder (for example, C:\Users\<username>\Documents\STK_ODTK 13\External_Data_Test) when the Save As dialog box opens.
- Enter My External Data in the File name field.
- Ensure Save as type is set to Text documents (*.txt).
- Click to create your External Data file and to close the Save As dialog box.
- Keep your text editor open.
Importing the External Data file using Connect
After the External Data file is created, you can use the ExternalData Connect command to associate the file with the Satellite object. The command allows for the association and management of time-ordered data computed outside of the STK application with STK objects. Data associated with STK objects via the ExternalData command can be accessed through the User Supplied Data data provider, and therefore become available for use in reporting, graphing, dynamic displays, strip charts, and data displays. This command is also useful for the real-time display of telemetry information on the 3D graphics window. The code syntax is:
ExternalData <ObjectPath> {DataOption} [<Parameters>]
Opening the Send a Connect Command Utility
Connect commands are normally passed from outside the STK application over a TCP/IP connection or through a COM interface. In this scenario, since you are executing a single Connect command, you'll use the Send a Connect Command Utility through an integrated Web Browser window in the STK Workspace. The Send a Connect Command Utility functions inside of the STK application; therefore, no outside connections are required.
- Return to the STK application.
- Click New Web Browser Window (
 ) on the Default toolbar.
 - Click Browse (
 ) on the Web Browser Controls toolbar when the Web Browser window opens.
 - Select the Example HTML Utilities folder in the left navigation pane when the Open dialog box opens.
- Select the STK Automation folder.
- Click .
- Select the Send a Connect Command folder.
- Click .
- Select Send_A_Connect_Command.htm.
- Click to confirm your selection and to close the Open dialog box.
You can also use the API Demo Utility to execute the Connect command.
Entering the Connect command in the Send a Connect Command Utility
The Send a Connect Command Utility allows you to execute a Connect command in the STK application by entering it into a text field and submitting it. Use the Send a Connect Command Utility to run your ExternalData Connect command.
- Copy and paste or enter the following Connect command in the Type (or paste) an STK/Command to execute field when the Send a Connect Command Utility opens.
- Copy and paste or enter the file path to your External Data.txt file inside the command's quotation marks (
""). - Click .
- Close the Web Browser window with the Send a Connect Command Utility when you are finished.
- Save () your scenario.
ExternalData */Satellite/TestSat ReadFile "" Save
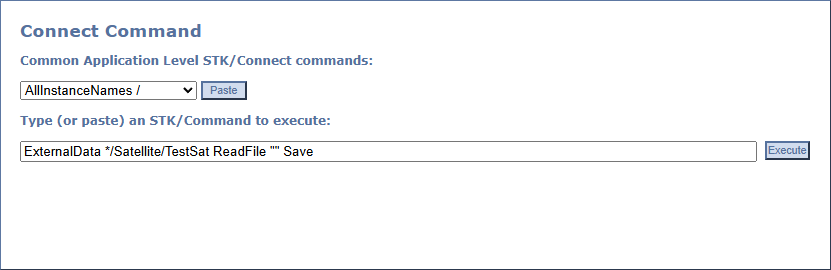
Send a Connect Command Utility
You can easily copy this path, including the surrounding quotation marks, by navigating to your scenario folder, right-clicking on your My External Data.txt file, and selecting Copy as path in the shortcut menu.
Your completed Connect command should look like this:
ExternalData */Satellite/TestSat ReadFile "C:\Users\<username>\Documents\STK_ODTK 13\External_Data_Test\My External Data.txt" Save
Creating a dynamic data display
Now that the data are read into the STK application and are associated with the Satellite object, you can create a custom report of the data and display it dynamically in the 3D Graphics window.
Creating a custom report style
Before you can display your external data in a dynamic data display, you must first create a custom report style using the
- Right-click on TestSat () in the Object Browser.
- Select Report & Graph Manager... (
 ) in the shortcut menu.
 - Select the External_Data_Test Styles (
 ) folder in the Styles panel list when the Report & Graph Manager opens.
 - Click Create new report style (
 ) on the Styles toolbar.
 - Name the new report style (
 ) External Data Text File.
 - Select the Enter key.
Updating the report contents
You can
- Select the Content page when the Properties Browser opens.
- Expand (
 ) the User Supplied Data () data provider.
 - Expand () the My Data () data provider group.
- Move (
 ) the following data provider elements to the Report Contents list:
 - Time (
 )
) - Distance ()
- Rate ()
- Click to confirm your selections and to close the Properties Browser.
Generating the External Data Text File report
With your report configured to use your user-supplied data, generate your custom External Data Text File report to view its contents.
- Click in the Styles panel.
- Review the report.
- When finished, close the External Data Text File report.
- Click to close the Report & Graph Manager.
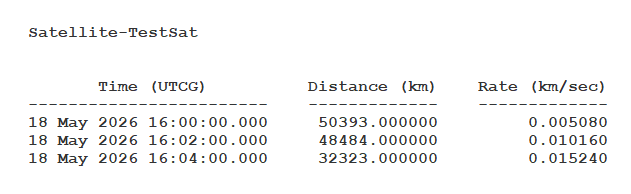
External Data Text File Report
Adding a dynamic data display to the 3D Graphics window
An object's 3D Graphics - Data Display properties are used to display dynamic data for the specified object in the 3D Graphics window. This feature is useful when presenting information that requires both visual and textual data.
- Open TestSat's () Properties ().
- Select the 3D Graphics - Data Display page when the Properties Browser opens.
- Click .
- Select External Data Text File in the Styles list when the Add a Data Display dialog box opens.
- Click to confirm your selection and to close the Add a Data Display dialog box.
- Click to confirm your changes and to close the Properties Browser.
Viewing the data display in the 3D Graphics window
With your dynamic data display configured, view it in the 3D Graphics window.
- Bring the 3D Graphics window to the front.
- Right-click on TestSat () in the Object Browser.
- Select Zoom To in the shortcut menu.
- Click X Real-time Animation Mode (
 ) on the Animation toolbar.
 - Click Start (
 ) to animate your scenario.
 - Click Reset (
 ) when finished.
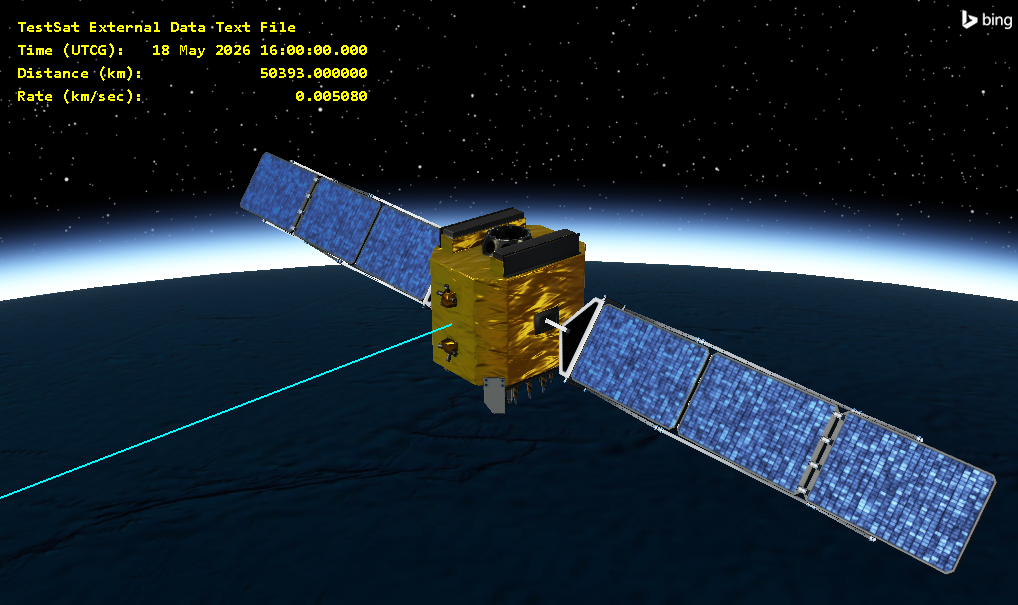
External Data Text File Dynamic Data Display
As the scenario plays, you can see a dynamic display of the external data in the 3D Graphics window. Data are interpolated as a first-order polynomial between the three available data points from your External Data file.
Creating a Calculation Scalar file
Another way to import external data into the STK application is by using a Calculation Scalar file. A
The following conventions must be observed when specifying data points for a Calculation Scalar file:
- Each line must contain only one data point.
- The values on each line must be separated by at least one space.
- The lines must be listed in ascending order in time but do not have to be evenly spaced in time.
- You cannot have multiple points at the same time.
- There must be at least as many points as specified by the
NumberOfPointskeyword.
There are two mutually exclusive formats used to specify actual data points in the Calculation Scalar file:
- TimeValues — Indicates that subsequent time-ordered tabulated data will contain two columns: time and scalar values
- TimeValueRates — Indicates that subsequent time-ordered tabulated data will contain three columns: time, scalar values, and their rates
For this tutorial, you will create a Calculation Scalar file using the TimeValueRates format.
Copying the contents of a Calculation Scalar file
For this scenario, use the TimeValueRates file format.
- Return to your .text editor.
- Create a new text file.
- Copy the TimeValueRates Calculation Scalar file sample text below:
- Paste the text into your text editor.
stk.v.10.0
BEGIN Data
	ReferenceEpoch    18 Sep 2013 16:00:00.000
	TimeFormat        DD/MM/YYYY
	UnitType          Distance
	ValueUnit         mi
	ValueRateUnit     ft/sec
	NumberOfIntervals 1
	BEGIN Interval
		NumberOfPoints 23
		BEGIN TimeValueRates
			18/09/2013 12:00:00.000   -0.00039702    -0.001
			18/09/2013 12:10:00.000   -0.00039605    -0.001
			18/09/2013 12:20:00.000   -0.00039901    -0.001
			18/09/2013 12:30:00.000   -0.00040111    -0.001
			18/09/2013 12:40:00.000   -0.00039512    -0.001
			18/09/2013 12:50:00.000   -0.00040421    -0.001
			18/09/2013 13:00:00.000   -0.00040824    -0.001
			18/09/2013 13:10:00.000   -0.00041515    -0.001
			18/09/2013 13:20:00.000   -0.00041222    -0.001
			18/09/2013 13:30:00.000   -0.00042328    -0.001
			18/09/2013 13:40:00.000   -0.00041925    -0.001
			18/09/2013 13:50:00.000   -0.00041634    -0.001
			18/09/2013 14:00:00.000   -0.00041034    -0.001
			18/09/2013 14:10:00.000   -0.00041133    -0.001
			18/09/2013 14:20:00.000   -0.00041036    -0.001
			18/09/2013 14:30:00.000   -0.00040242    -0.001
			18/09/2013 14:40:00.000   -0.00040734    -0.001
			18/09/2013 14:50:00.000   -0.00039937    -0.001
			18/09/2013 15:00:00.000   -0.00040344    -0.001
			18/09/2013 15:10:00.000   -0.00039938    -0.001
			18/09/2013 15:20:00.000   -0.00040345    -0.001
			18/09/2013 15:30:00.000   -0.00041202    -0.001
			18/09/2013 15:40:00.000   -0.00041202    -0.001
		END TimeValueRates
	END Interval
END Data
Reviewing the Calculation Scalar file's contents
Take a look at the contents of the Calculation Scalar file.
- Review the version stamp.
- Review the keyword phrases at the beginning of the file.
ReferenceEpoch— the reference epoch time for the time values of the calculation scalar data in the file in the Gregorian UTC time format. There is no relationship between the reference epoch specified in the calculation scalar file and the actual scenario epoch in your scenario.TimeFormat— specifies a keyword defining the date format of time tags. If set, each line of data in the file begins with a time in the specific date format followed by the rest of the data. Spaces are valid whenever the format admits them (for example,1 Jun 2026 16:00:00.000), but quotation marks around time strings are invalid.UnitType— the type of tabulated scalar data in the fileValueUnitandValueRateUnit— define the units of the tabulated data in the file. The unit must be valid for the specifiedUnitType. Requires corresponding units, including compound units, to be specified using abbreviations; in this example,miandft/sec. The specified abbreviation strings must be consistent with theUnitType. IfValueUnitorValueRateUnitare omitted, it is assumed that SI units appropriate for the specifiedUnitTypeare used.NumberOfIntervals— the number of intervals containing time-ordered tabulated scalar data. This entry must precede actual intervals.- Review the Interval keyword group and its contents.
NumberOfPoints— the number ofTimeValueRatesentries within an interval. This entry must precede actual paired data.TimeValueRates— time-ordered tabulated data containing three columns: <TimeInSeconds> <ScalarData> <TimeRateOfChange>, where:- <
TimeInSeconds> is the time value of the point in seconds (in the formatxxxx.xxx) relative to the epoch as defined by theReferenceEpochkeyword - <
ScalarData> are one ore more scalar data points in units specified by theDimensionNamekeyword - <
TimeRateOfChange> is the time rate of change of the corresponding value
As with the External Data file, a Calculation Scalar file must contain the earliest compatible version of the STK software for which the file is formatted to be used.
Copying the satellite's orbit epoch
As before, update the Calculation Scalar file's reference epoch to match that of your satellite.
- Return to the STK application.
- Open TestSat's () Properties ().
- Select the Basic - Orbit page when the Properties Browser opens.
- Locate the Orbit Epoch field.
- Copy the Orbit Epoch time (for example, 01 Jun 2026 16:00:00.000 UTCG).
- Click to close the Properties Browser without making any changes.
Updating the Calculation Scalar file's reference epoch
As before, update the file's reference to match that of your satellite. It is important to note that the times in the data file are given as seconds past the reference epoch.
- Return to your text editor.
- Replace the
ReferenceEpoch's associated value with the Orbit Epoch time from TestSat. - Delete the
UTCGunit label.
Your file's ReferenceEpoch keyword phrase should look like the example below:
ReferenceEpoch 1 Jun 2026 16:00:00.000
Updating the Calculation Scalar file's Value and ValueRate units
Right now, the units for your tabulated data are specified to be miles and feet per second. Update the ValueUnit and ValueRateUnit keyword phrases with more appropriate unit abbreviations.
- Replace
ValueUnit's associated value withkm. - Replace
ValueRateUnit's associated value withkm/sec.
Your keyword phrases should appear as below:
ValueUnit         km
ValueRateUnit     km/sec
Changing the TimeInSeconds
The file's TimeFormat specifies that the time data appear in the DD/MM/YYYY. However, the sample file's data are configured for a reference epoch of September 28, 2013, starting at 12:00:00.000 UTCG. Update the file to use an epoch and time steps appropriate for your analysis period.
- Open your text editor's find-and-replace dialog box.
- Enter 18/09/2013 in the Find field.
- Enter the starting date of your scenario's analysis period in the DD/MM/YYYY format.
- Click .
- Close the find and replace dialog box.
- Manually update the times so they are relative to the starting hour of your scenario's analysis period.
For example, 01/06/2026.
Data are reported every ten minutes over a period of three hours and forty minutes, so if your scenario's Reference Epoch starts at 16:00:00.000, the time of your final data entry point should be 19:40:00.000.
Your finished Calculation Scalar file should appear similar to the one shown below:
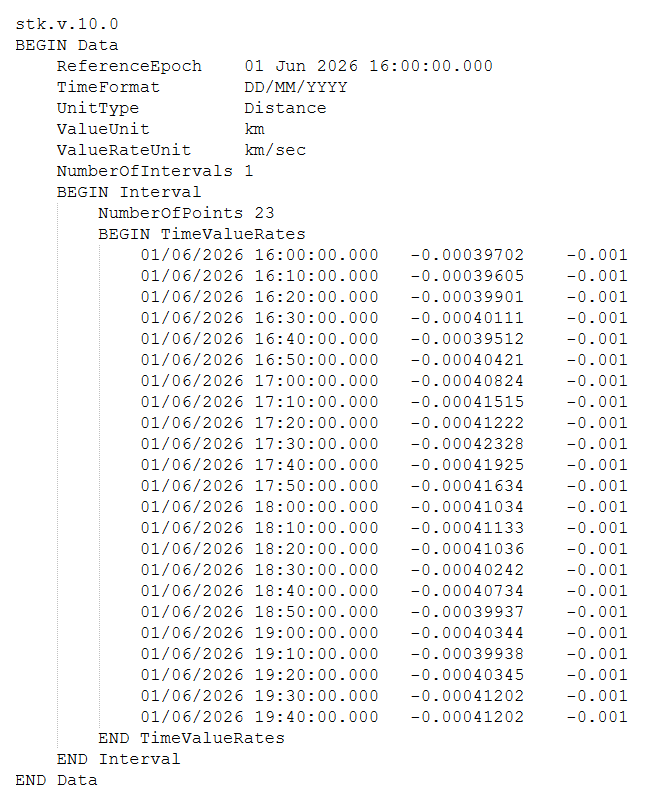
Edited CSC File
Saving the Calculation Scalar file
With your file configured, save it in Calculation Scalar file format.
- Open the File menu.
- Select Save As.
- Browse to your scenario folder (for example, C:\Users\<username>\Documents\STK_ODTK 13\External_Data_Test) when the Save As dialog box opens.
- Open the Save as type drop-down list.
- Select All files: (*.*).
- Enter MyTimeValueRate.csc in the File name field.
- Click to create your External Data file and to close the Save As dialog box.
- Close your text editor.
Importing the Calculation Scalar file using the Calculation tool
The Analysis Workbench capability comprises four application-wide tools that you can use to create custom components and insert them into your scenarios. The Calculation tool creates time-varying computational results. You can use the Calculation tool to reference your external Calculation Scalar file's data.
Opening the Calculation tool
Open the Calculation tool with TestSat.
- Right-click on TestSat () in the Object Browser.
- Select Analysis Workbench... (
 ) in the shortcut menu.
 - Select the Calculation tab when the Analysis Workbench opens.
Creating a new Scalar Calculation component
Scalars are Calculation components that produce scalar time-varying calculations. Create a new Scalar Calculation component to use your Calculation Scalar file.
- Ensure TestSat () is selected in the object tree.
- Click Create new Scalar Calculation (
 ).
).
Defining the Scalar calculation
The
- Click Type: when the Add Calculation Component dialog box opens.
- Select File () in the Select Component Type list when the Select Component Type dialog box opens.
- Click to confirm your selection and to close the Select Component Type dialog box.
- Enter MyTelemetryData in the Name field.
- Click the Fielname ellipsis (
 ).
). - Browse to the location of your MyTimeValueRate.csc file when the Select File dialog box opens.
- Select MyTimeValueRate.csc.
- Click to confirm your selection and to close the Select File dialog box.
- Click to confirm your changes and to close the Add Calculation Component dialog box.
- Click to Close the Analysis Workbench.
This will become the name of the data provider group containing your custom data provider elements used for reporting.
You can also use the Calculation tool to use data from an External Data (*.txt) file that has been read into the STK application. The Data Element type of Scalar Calculation lists every scalar time-varying element from the STK data provider system, which allows you to take advantage of existing STK computational output. This includes the User Supplied Data data provider, which you can use to incorporate data from your External Data file into new frameworks within the Calculation tool. The data must have a time element and must not require additional data. The Data Element Scalar Calculation type is not valid for Central Body objects, Templates, or Comm objects like Antennas, Radars, Receivers, and Transmitters.
Creating another dynamic data display
Now that the data from your Calculation Scalar file are associated with the Scalar Calculation component, create a custom report to use for another dynamic data diplay.
Creating a custom report style
Create another custom report style using the Report & Graph Manager.
- Right-click on TestSat () in the Object Browser.
- Select Report & Graph Manager... () in the shortcut menu.
- Select the External_Data_Test Styles () folder in the Styles panel list when the Report & Graph Manager opens.
- Click Create new report style () on the Styles toolbar.
- Name the new report style () External CSC Telemetry Data.
- Select the Enter key.
Updating the report contents
In this case, you will customize your report using the
- Select the Content page when the Properties Browser opens.
- Expand () the Scalar Calculations () data provider.
- Expand () the MyTelemetryData () data provider group.
- Move () the following data provider elements to the Report Contents list:
- Time ()
- Scalar ()
- Scalar Rate ()
Note that unlike with the User Supplied Data data provider, the names of the Scalar and Scalar Rate data provider elements are already configured by default with the Scalar Calculations data provider. To update your data display labels, you must re-title these elements elsewhere.
Updating data provider options
Set the report's
- Select Scalar Calculations-MyTelemetryData-Scalar in the Report Contents list.
- Click .
- Enter Distance in the Title field when the Options dialog box opens.
- Click to confirm your change and to close the Options dialog box.
- Select Scalar Calculations-MyTelemetryData-Scalar Rate in the Report Contents list.
- Click .
- Enter Rate in the Title field when the Options dialog box opens.
- Click to confirm your change and to close the Options dialog box.
- Click to confirm your changes and to close the Properties Browser.
Generating the External CSC Telemetry Data
With your report configured to use your user-supplied data, generate your custom External CSC Telemetry Data report to view its contents.
- Click in the Styles panel.
- Review the report.
- When finished, close the External CSC Telemetry Data report.
- Click to close the Report & Graph Manager.
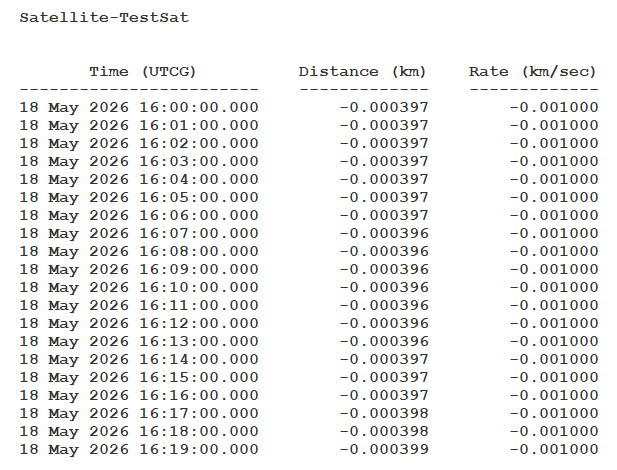
External CSC Telemetry Data Report
Updating the dynamic data display to the 3D Graphics window
Update TestSat's properties to use the External CSC Telemetry Data report for the dynamic data display.
- Open TestSat's () Properties ().
- Select the 3D Graphics - Data Display page when the Properties Browser opens.
- Clear the Show check box for External Data Text File in the table.
- Click .
- Select External CSC Telemetry Data in the Styles list when the Add a Data Display dialog box opens.
- Click to confirm your selection and to close the Add a Data Display dialog box.
- Click to confirm your changes and to close the Properties Browser.
Viewing the data display in the 3D Graphics window
View your updated dynamic data display in the 3D Graphics window.
- Bring the 3D Graphics window to the front.
- Zoom To TestSat ().
- Click Normal Animation Mode (
 ). on the Animation toolbar.
 - Click Start () to animate your scenario.
- Click Reset () when you are finished.
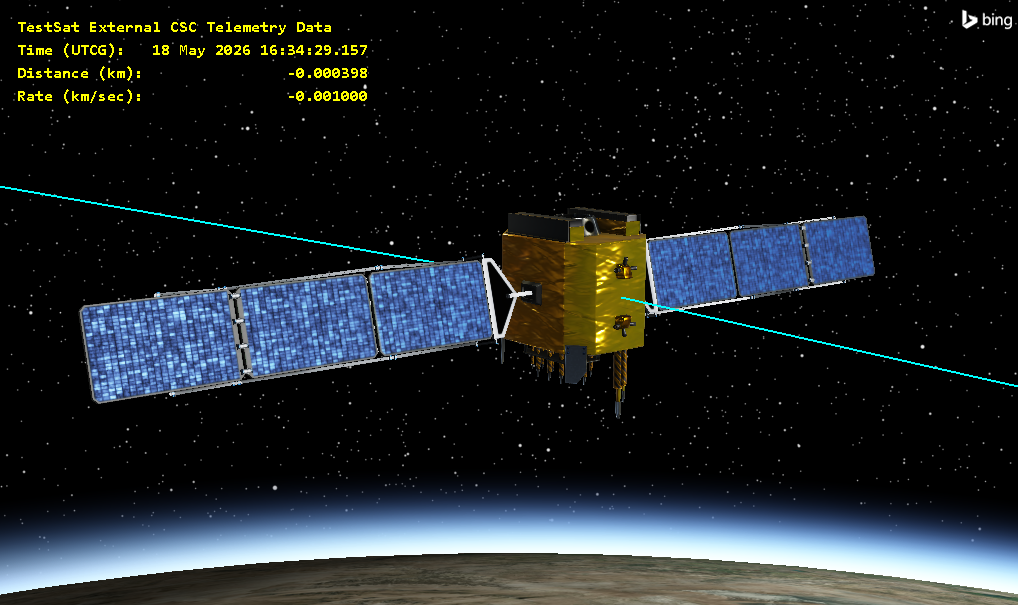
3D Graphics External CSC Telemetry Data Display
Saving your work
Clean up your workspace and save your scenario.
- Close any open reports, properties and tools.
- Save () your work.
Summary
You began by creating an External Data file and examining its contents. After reading the file into the STK application using a Connect command, you used the User Supplied Data data provider to create a custom report for a dynamic data display in the 3D Graphics window. You then created and formatted a Calculation Scalar file and referenced it using a File-type Scalar Calculation in the Analysis Workbench's Calculation tool. After creating another custom report using the Scalar Calculations data provider, you updated the dynamic data display to show data from your Calculation Scalar file. By configuring external files to be readable by the STK application, you can use the data they contain in new frameworks available through the STK application's data providers and tools for a variety of applications, from the display of the data, to scalar calculations, and beyond.