Tracks Workflow
Tracks Object Tree
The Tracks Object Tree enables you to quickly identify what tracks belong to which analysis objects. The Object Tree informs you if the track has been promoted, if the track is being displayed, and if the filter or constraints have been applied to the track.
All tracks must have unique names. At any point you can right-click to gain access to the New Track Options menu. You can also demote a track from a heavy object to a track. To learn more about the New Track Options, refer to the New Track Options section.
If a Track has an existing Track ID constraint before the Smart Filter is run, the track is evaluated based on those existing constraints and then the resulting new constraints from the Smart Filter are applied.
Track Caching
In the Edit > Preferences... menu of STK, you can enable track caching. Track Caching caches all track data that is mapped in the Track Mapping and the selected Track Pick Mapping for newly created tracks. The setting is active by default. This option increases memory usage for optimal performance of various track functions including picking, coloring, filtering, etc.
Tracks Object Tree Toolbar
The toolbar above the Tracks Object Tree provides commands that can be used to manipulate track data.
| Option | Description |
|---|---|
| New Track ( |
Enables you to create a new track. New track options can be found below. |
| Duplicate Track ( |
Duplicates the currently selected track while maintaining current filters, constraints, dynamic settings, and track customizations |
Refresh Track Graphics ( ) ) |
Updates any changes to the track |
| Track Properties ( |
Opens the properties tab for the track. |
| Filter Track Data ( |
Filters the MTOs displayed for a track to times when the selected condition is satisfied. To see the filter types, see below. |
| Delete Selected Track ( |
Deletes the selected track. |
| Promote Track to STK Object ( |
Promote the track to the STK Track Promotion Type selected during Track setup. This enables you to perform more complex analysis with the object like access, track comparison, etc.
In order to animate by the track time array, the track must be promoted. See Track Time Animation for more information. |
| Promote to Vector ( |
When a track is created with AzEl Mapping, you can promote the track to a vector. A promoted track cannot be named or unnamed. You will need to demote it in order to change it. |
Right-click Context Menu
You can right-click in the Tracks panel and get the following options:
| Option | Description |
|---|---|
| New Track | Enables you to create a new track. New track options can be found below. |
| Duplicate Track | Duplicates the currently selected track while maintaining current filters, constraints, dynamic settings, and track customizations |
| Refresh | Updates any changes to the track |
| Properties | Opens the properties tab for the track. |
| Filter | Filters the MTOs displayed for a track to times when the selected condition is satisfied. To see the filter types, see below. |
| Delete | Deletes the selected track. |
| Promote |
Promote the track to the STK Track Promotion Type selected during Track setup. This enables you to perform more complex analysis with the object like access, track comparison, etc. A promoted track cannot be named or unnamed. You must demote the track in order to change it. |
| Demote | Demotes the STK object. |
| Preview |
Opens the Track Preview panel and displays:
The show duplicate time window reports all duplicate times, the number of occurrences, and the row number. If a track contains unnamed points, then the Preview by Track IDs field will display a second column showing the number of unnamed points.
|
| Save | Creates a CSV for the selected track that includes time, position information, and Track ID |
New Track Options
The Tracks workflow allows you to customize tracks. When creating a new track, the following options are available:
| Option | Description |
|---|---|
| Analysis Object | Select an analysis object associated with the new track. |
| Track Name | Specify the name of the new track. |
| Track Promotion Type | Specify the STK object type that will be applied to the track if gets promoted. Available values include Aircraft, Ground Vehicle, Ship, Missile, Satellite, and Launch Vehicle. The default value is Aircraft. |
| Track Mapping | Provides an alphabetized list of existing track mappings. Mappings are valid for imported files and can be used are in bold text. |
| Frame Object | Enables you to set the source of the reference frame specified in the selected track mapping. |
| Pick Info Data Group | Provides a list of Pick Info mappings in alphabetical order. |
| Constrain Data by Track ID | If the track file contains Track IDs, you can filter the track to only the IDs of interest. Inputs must be in a list format like 1,4,5,7. |
| Constrain Data by Time | Enables you to select time components to limit when tracks are calculated. |
When the track is created by this method, it displays in the Tracks Object tree with the normal track icon ( ). Tracks that are created using Track Truth Matching will display with a different icon (
 ).
).
Filter Track Data Options
The following track filter options are available:
| Option | Description |
|---|---|
| Bounded | Tracks are displayed when the selected metrics are between the specified Min/Max. |
| Explicit | Track are displayed when the selected metric matches the specified value. |
| Explicit List | Tracks are displayed when the selected metric satisfies any of the values displayed in Explicit/Min. Values should be separated by a comma (1,2,5). |
| GreaterThan | Tracks are displayed when the selected metric is greater than any of the values displayed in Explicit/Min. |
| LessThan | Tracks are displayed when the selected metric is less than any of the values displayed in Max. |
| Index | Tracks are displayed without any of the values displayed in Explicit/Min. Values should be separated by a comma e.g. 1,2,5. |
| Operation | Enables you to choose to Include or Exclude a track filter. The Include option is selected by default. |
Add Filter ( ) ) |
Add a new filter to the track. |
Remove Filter ( ) ) |
Removes the currently selected filter from the table. |
| Open a Filter Set ( |
Load a TETK filter Config (*.tefc) file that contains filters saved by the user. |
| Export Filter Row ( |
Exports the current filter configuration to a *.tefc file |
Calculate Min/Max ( |
Displays the minimum and maximum values for the currently selected metric |
| Quick Graph ( |
Create a graph of the selected metric vs. time. The graph covers the interval defined in the Constrain Data by Time field on the track setup panel. If an interval was not defined here, the graph uses the Analysis Objects availability time. |
Preview Filter ( ) ) |
Previews the number of items, duplicate times, and statistics of the filtered data. |
Constraints
Track ID / Time Constraint
To filter the selected track by IDs, click to set the IDs of interest (i.e., the IDs to be included). The filtered list shows the IDs of the previously filtered track points, and the list of all shows the IDs of all track points in the file. If no IDs are specified, all Track IDs are included.
To set time constraint boundaries for individual Track IDs, click  to open the time constraint dialog. Enter the Track ID and the start/stop times using any supported date-time format. If a start/stop time is left blank, only the Track ID will be used in the filter. The earliest and latest time for that TrackID can be retrieved by clicking at the end of the row. Only points between the start time and stop time (inclusive) that belong to that Track ID are included.
To exclude specific track IDs, check the Exclude check box. Excluding Track IDs ignores the time constraints and excludes all points belonging to that Track ID.
Bounds Constraint
To select a region in the 3D Graphics window (using Ctrl+click) that will bound the area of interest; click  . Tracks outside of the bounded area will be filtered out. You will then be prompted to switch the view to ECF to increase the accuracy of the drawing. To remove the constraint, click
 ![]() . To see the changes in the 3D window, click Apply.
. To see the changes in the 3D window, click Apply.
From the Constraints tab, you can edit the coordinates of the bounded area, and save those changes by clicking Apply. A new bounds constraint can also be created by entering the desired coordinates and clicking Apply.
Additionally, you can show the applied coordinates of the bounded area by clicking the check box "Show Applied Boundary". The color of the constraint can also be changed using the color picker.
Index Filter Constrain
Click the Index Filter ( ) button enable you to use CTRL + click to select a group of MTO points using a selection rectangle. These points have their IDs added to an index filter that is added to the filters group. These filters can be edited via the Tracks Workflow Filter Configuration. Note that points that match the index are excluded.
To remove a filter, click the ![]() icon.
icon.
Track Graphics
| Option | Description |
|---|---|
| Pixel Size | Defines the display size of track points. |
| Translucency | Defines the translucency value of a track's fill. A translucency value of zero results in the fill being fully opaque, whereas a translucency value of 100 results in the fill being fully transparent. |
| Show Unnamed Points | If the track was generated by the Track Truth Matching workflow and has unnamed points, you can toggle the display of those points using this check box. |
| Connect Track Points | Selecting this options connects track points to each other with lines. |
| White Connection Lines | Selecting this options ensures lines created by "Connect Track Points" remain white. Otherwise Connection Lines will be displayed with the same color as the first track point of each Track Id group. |
| Show Ownship to Track |
Selecting this options connects track points to their ownship positions with lines. Additionally, you can define the frequency to draw the ownship to the track line. For instance, entering 1/[2] in the field next to Show Ownship to Track displays a line drawn to every other track point. If a track has a large amount of points (greater than 10,000), it is recommended that you define the frequency to display fewer lines to reduce clutter. |
| Dynamic Settings |
Provides three options for the duration that track points will be displayed.
|
| Draw in System | Click Choose System to specify a coordinate system in which to display the track points. |
Track Customization
Points
The Points tab enables you to specify the look and feel of the tracks.
| Option | Description |
|---|---|
| Static | Specify a constant color and icon for the given track. |
| Color by Values |
Provides three simple options and one advanced option to set the color of the selected track based on values from a selected data element.
|
| Color by Track ID | If the Track ID is mapped, the track points will be assigned a color based on the Track ID. |
Labels
The Labels tab enables you to specify a data element value to display at each MTO point. The labels displayed can be the distance fom the object, number of significant digits, and label color.
Covariance
If a track file contains covariance information and is included in the track mapping, covariance ellipses can be drawn if the track is promoted. Note that the track must be promoted for these to display.
- Scale - Increases or decreases the size of the ellipse.
- Default Color - Color of the ellipse drawn
- Use Comparison Color - If a track comparison is performed the ellipse is drawn green if the truth object is inside the ellipse or red if outside.
Error Ellipse
If a track file contains In-Track or Cross-Track errors, error ellipses are drawn once the track is promoted. Note that the track must be promoted for these to display.
- Show Error Ellipse - An ellipse is drawn at whatever altitude is reported by the point. This ellipse can become buried under terrain if terrain is being used. If the error ellipse is enabled after a track comparison is completed, the track is colored either green or red. If the ellipse color is green, the EllipseErrorOut doesn't equal one (1). If the ellipse color is red, the EllipseErrorOut equals one (1).
- Show Ground Ellipse - Similar to the Show Error Ellipse, but draws only an outline of the ellipse on terrain.
Current State
The Current State tab enables you to customize an icon and label that will display on the track to highlight the current point.
Marker
The Marker configuration area enables you to apply marker preferences for all current markers.
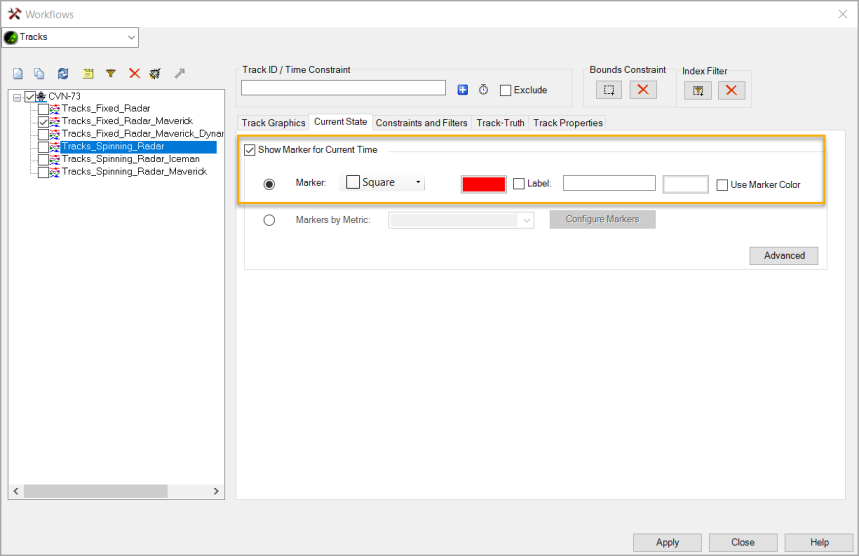
The below table describes the available Marker configuration settings.
| Field/Button | Description |
|---|---|
| Marker Type | Selects the predefined marker shape to be displayed at the current point. |
| Color | Selects the color of the Marker at the current point. |
| Label | Sets the text label to display at the current point. |
| Label Color | Sets the color of the Label at the current point |
| Same as Marker | Sets the Label to use the same color settings as the Marker. |
Markers by Metric
The Markers by Metric configuration area enables you to select a saved configuration for display of the current point marker
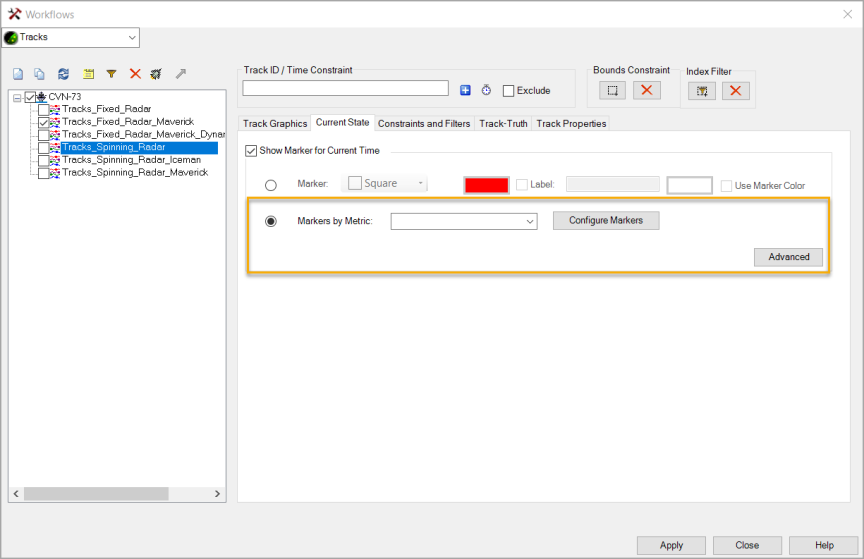
Saved Marker Configurations
Marker configurations are saved to your configuration folder and persist between scenarios. The Markers by Metric dropdown list populates with all valid saved Marker Configurations for the current track and auto-selects the configuration that matches the current track's Marker settings if any match exists.
Upon selecting a Marker Configuration for a track, that configuration is also saved to the scenario folder. This ensures that the configuration persists when the scenario is shared with other users and can be added to other user's Marker Configuration List.
A track's selected Marker Configuration settings are saved with the track. When a Marker Configuration is edited, tracks that previously used that configuration are not automatically updated to the new configuration settings and become out of sync. When a track is out of sync with its saved marker templates, the selected configuration name will not be populated in the Configuration dropdown. To sync the track to the current marker settings, you must re-select the configuration from the drop-down and click Apply.
Similar to mappings, if a scenario is shared and loaded that contains a Marker Configuration that is not currently saved your saved Marker Configurations list, it is added to your Marker Configuration list. If an external scenario is loaded with a Marker Configuration name that already exists, the existing Marker Configuration is not overwritten, but the tracks using the external Marker Configuration will still display as intended by the original author.
Configure Markers
Clicking the Configure Markers button enables you to manage the saved marker configurations that apply markers based on data element values corresponding with the current point.
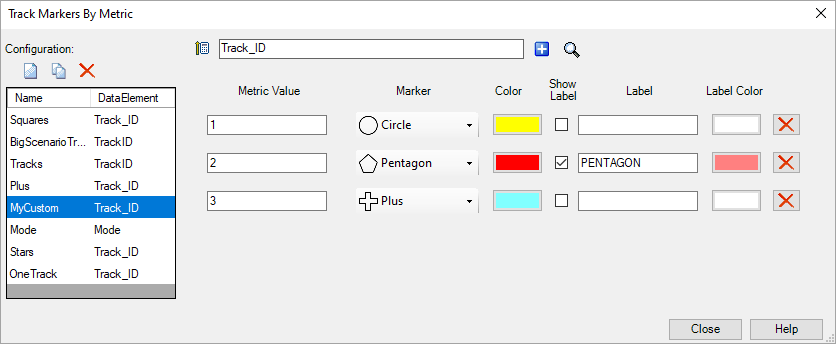
The below table describes the available configuration settings.
| Field/Button | Description |
|---|---|
| New ( |
Creates a new Metric Configuration with a specified name. Names must be unique. |
| Duplicate ( |
Copies the selected configuration, providing a new name for the duplicate. |
| Delete Configuration ( |
Removes the selected configuration. |
Data Element ( ) ) |
Selects the data element to compare values against the set value and marker type pairs. |
|
Add Metric Row ()
|
Adds a new Metric Value row. |
| Select Metric Values () |
Select from a list of possible values for the chosen metric. |
| Metric Value | Sets the data element value that corresponds to the set marker type. |
| Marker Type | Selects the predefined marker to be displayed at the current point when the set metric value is matched. |
| Color | Selects the color of the Marker at the current point. |
| Show Label | Indicates if the label should be displayed or not. |
| Label |
|
| Label Color | Sets the color of the Label at the current point. |
| Delete Row ( |
Removes the metric row. |
Clicking the Advanced Settings button enables you to configure size and offset settings that are applied to all markers.
| Field/Button | Description |
|---|---|
| Marker Size |
|
| Marker Stroke Width | Sets the width of the lines that draw the marker shape. |
| Label Offset | Sets the X and Y pixel offsets of the Label position. |
Adding Tracks
Upon clicking the Add Workflow ( ) button, the resulting window enables you to select the Tracks workflow.
On the new Track panel, you can click the New Track (![]() ) button to launch the track creation form.
) button to launch the track creation form.
Assigning a Track-Truth Object
Assigning a Truth Object enables features in the Track Pick window that allow you to cull points from the track via the naming and unnaming of selected points. The Truth Object is automatically assigned to the track that is generated by the Track Truth Matching workflow.
After points have been unnamed on a track, the Assign Truth Object button () is disabled and the track's truth object cannot be changed.
The table below describes the Track Attribution buttons that are available on the Track Workflow panel.
| Field/Button | Description |
|---|---|
| Assign Truth Object () |
Opens a new dialog enabling you to select a valid STK object to assign to the selected track. This button will be disabled when unnamed points exist on the track. |
Track Attribution Summary ( ) ) |
Opens a new dialog that displays a summary of points per track ID, the number of Named points and the number of Unnamed points. This button becomes enabled when unnamed points exist on the track. |
Clear Track Attribution ( ) ) |
Clears all unnamed points from a track and clears the currently assigned Truth Object. This button becomes enabled when unnamed points exist on the track. |
Generate Report ( ) ) |
Creates a report that displays the data fields and number of points that were used. This button becomes enabled when unnamed points exist on the track. |
| Show Report () |
Opens the generated .csv report in MS Excel or an equivalent application. This button becomes enabled when unnamed points exist on the track. |