STK Pro, STK Premium (Air), STK Premium (Space), or STK Enterprise
You can obtain the necessary licenses for this tutorial by
This lesson requires version 12.9 of the STK software or newer to complete in its entirety.
An internet connection is not required to complete this tutorial. All objects can be added and modified in such as way that those who work in an environment where online operations are disabled can complete this tutorial in its entirety.
The results of the tutorial may vary depending on the user settings and data enabled (online operations, terrain server, dynamic Earth data, etc.). It is acceptable to have different results.
Capabilities covered
This lesson covers the following capabilities of the Ansys Systems Tool Kit® (STK®) digital mission engineering software:
- STK Pro
Problem statement
Engineers and operators require a quick and simple way to simulate the multihop relaying of data between satellites and ground sites in near real-time. With increased seismic activity in the region, the Italian government wants to monitor the geography of the area around of one of Rome's greatest tourist attractions: the Colosseum. They want you to collect imagery of the ancient Roman landmark so they can keep a check on its structural integrity. To do this, you must take as many pictures of the Colosseum as possible during a three-week analysis period and return them to select ground stations.
Solution
Using the STK software, you can determine when you can take images of the Colosseum during the daylight hours of the analysis period. You will use the cameras attached to two Landsat earth-observing satellites to image the site. After you take the pictures, you will uplink them to satellites in the Tracking and Data Relay Satellite System (TDRSS) constellation, which will then downlink them to an accessible ground station at White Sands or Guam in near real-time. You will take processing delays and link distance into account in your analysis.
What you will learn
Upon completion of this tutorial, you will have an understanding of the following:
- How to build Constellation objects
- How to build Chain objects
- How to model near-real-time data relays
- How to model processing delays in a communications system
Video guidance
Watch the following video. Then follow the steps below, which incorporate the systems and missions you work on (sample inputs provided).
Creating a new scenario
First, you must create a new STK scenario and then build from there.
- Launch the STK application (
 ).
). - Click
 Create a Scenario in the Welcome to STK dialog box.
 - Enter the following in the STK: New Scenario Wizard:
- Click when you finish.
- Click Save (
 ) when the scenario loads. The STK application creates a folder with the same name as your scenario for you.
 - Verify the scenario name and location in the Save As dialog box.
- Click .
| Option | Value |
|---|---|
| Name | Image_Relay |
| Start | 1 Nov 2023 16:00:00.000 UTCG |
| Stop | + 21 days |
Save (![]() ) often during this lesson!
) often during this lesson!
Modeling the Colosseum
The Colosseum is located in the heart of Rome and is your point of interest for this study. You can represent it analytically with a
Inserting a Target object
Insert a Target object that you will use as an aiming point for imaging the Colosseum.
- Bring the Insert STK Objects tool (
 ) to the front.
 - Select Target (
 ) in the Select An Object To Be Inserted list.
 - Select Insert Default () in the Select A Method list.
- Click .
- Right-click Target1 () in the Object Browser.
- Select Rename in the shortcut menu.
- Rename Target1 () Colosseum.
Changing the Colosseum's location
Move the Colosseum Target object to its geographic location in Rome.
- Right-click Colosseum () in the Object Browser.
- Select Properties (
 ) in the shortcut menu.
 - Select the Basic - Position page when the Properties Browser opens.
- Enter the following coordinates in the Position panel:
- Click to accept your changes and to close the Properties Browser.
| Option | Value |
|---|---|
| Latitude | 41.8902 deg |
| Longitude | 12.4924 deg |
Viewing the Colosseum in the 2D Graphics Window
You can view the Colosseum in the 2D Graphics window.
- Bring the 2D Graphics window to the front.
- Click Zoom In (
 ) in the 2D Graphics window Default toolbar.
 - Click and hold to draw a selection rectangle around Colosseum ().
- Do this as many times as you need to until you can clearly see the Colosseum.
If you do not have an internet connection, the default imagery will not have enough resolution to show the Colosseum. That is OK; your analysis will not be affected.
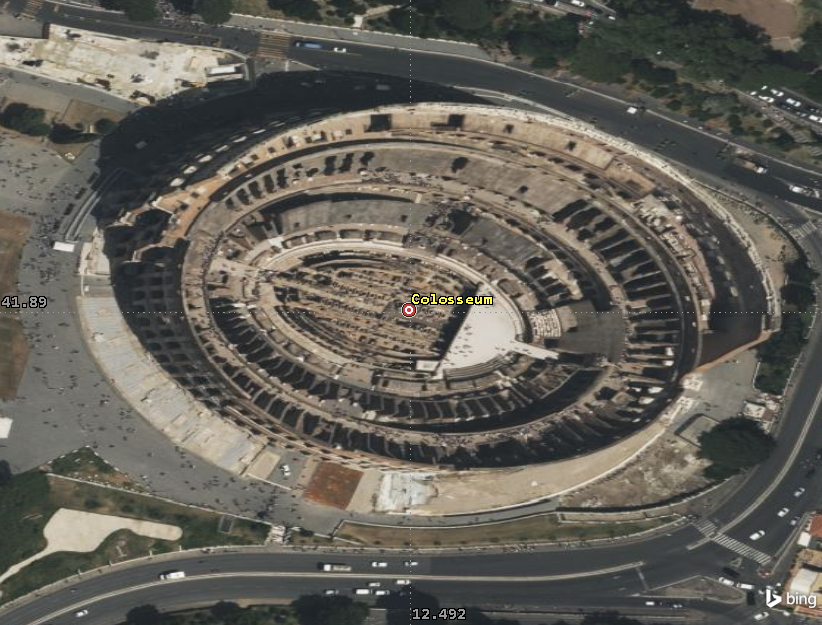
2D Graphics View of the Colosseum
Modeling the TDRSS ground stations
You will add two ground stations to your scenario that will receive the downlinked images of the Colosseum. Specifically, you will add the White Sands Ground Terminal and the Guam Remote Ground Terminal, which are parts of the ground segment of the TDRSS.
Inserting the White Sands Ground Terminal
Insert a facility object to model the White Sands Ground Terminal.
- Insert a Facility (
 ) object using the Insert Default () method.
 - Rename Facility1 () WhiteSands.
Changing White Sands' location
Place the Facility object at the location of the ground station located at White Sands in New Mexico.
- Open WhiteSands' () Properties ().
- Select the Basic - Position page.
- Enter the following coordinates in the Position panel:
- Click .
| Option | Value |
|---|---|
| Latitude | 32.501 deg |
| Longitude | -106.609 deg |
Inserting the Guam Remote Ground Terminal
Insert a Facility object to represent the Guam Remote Ground Terminal.
- Bring the Insert STK Objects tool () to the front.
- Insert a Facility () object using the Insert Default () method.
- Rename Facility2 () Guam.
Changing Guam's location
Update the Facility object to place it at the location of a ground site located on the island of Guam.
- Open Guam's () Properties ().
- Select the Basic - Position page.
- Enter the following coordinates in the Position panel:
- Click .
| Option | Value |
|---|---|
| Latitude | 13.587 deg |
| Longitude | 144.841 deg |
Grouping the TDRSS ground stations with a Constellation object
You inserted two of the ground stations used by the TDRSS network into your scenario. You can group them together with a Constellation object. A
- Insert a Constellation (
 ) object using the Insert Default () method.
 - Rename Constellation1 () TDRSS_Ground.
- Open TDRSS_Ground's () Properties ().
- Select the Basic - Definition page in the Properties Browser.
- Select Facility () in the Selection filter panel.
- Move (
 ) the Facility () objects from the Available Objects list to the Assigned Objects list.
 - Click .
Modeling the imaging and relay satellites
You will take pictures of the Colosseum using two Landsat satellites. Landsat satellites have been used to collect images of earth since the 1970s. You will then uplink the images to selected Tracking and Data Relay Satellites (TDRS). The TDRS constellation consists of a number of satellites in geosynchronous orbit that provide near-continous relay services for a variety of missions.
You will use a
Creating the TLE file
You can use a common text editor to create a TLE file which contains data for the Landsat and TDRS satellites, which you will then use to seed new Satellite objects in your scenario.
- Copy the following TLE set:
- Open a simple text editor of your choice, such as Windows Notepad, that doesn't add special formatting to the file contents.
- Paste the copied TLE set.
- Open the File menu.
- Select Save As....
- Select the path to your scenario folder (typically C:\Users\<username>\Documents\STK_ODTK 13\Image_Relay).
- Open the Save as Type drop-down list.
- Select All Files.
- Enter ImageRelaySats.tce in the File Name field.
- Click .
1 39084U 13008A   23305.66666667  .00000788  00000-0  17506-3 0 00006
2 39084 098.2129 013.8099 0001261 082.8167 241.4447 14.5711500657013
1 49260U 21088A   23305.66666667  .00000808  00000-0  17963-3 0 00000
2 49260 098.2166 013.8191 0001081 091.8006 052.7534 14.57130938111417
1 39504U 14004A   23305.66666667 -.00000172  00000-0 -45723+1 0 00008
2 39504 003.5751 357.8230 0004684 209.6858 032.1624 01.00277521035834
1 19548U 88091B   23305.66666667 -.00000187  00000-0 -28053+1 0 00004
2 19548 013.3406 347.5386 0038143 329.4717 274.7927 01.00268280115758
1 22314U 93003B   23305.66666667 -.00000182  00000-0 -25996+1 0 00006
2 22314 014.1564 004.0867 0010330 165.2147 065.4117 01.00267509112797
1 23613U 95035B   23305.66666667 -.00000085  00000-0 -20014+1 0 00004
2 23613 013.7786 354.8456 0023746 069.7609 300.7728 01.00267736103545
Inserting the Landsat satellites
Insert the Landsat satellites into your scenario from your TLE file and group them into a constellation for further analysis. The TLE set contains the mean elements that are used in conjunction with the STK software's
- Insert a Satellite (
 ) object using the From TLE file (
 ) method.
 - Navigate to your scenario folder when then Select a TLE File dialog box opens.
- Select ImageRelaySats.tce.
- Click .
- Review the listing of Satellites.
- Select both LANDSAT 8 and LANDSAT 9 in the Common Name column of the search list when the Insert From Satellite Database dialog box opens.
- Select the Create Constellation from Selected check box in the Insert Options panel.
- Enter Landsat_Sats in the Name field.
- Click to create the Landsat_Sats constellation and to keep the Insert From Satellite Database dialog box open.
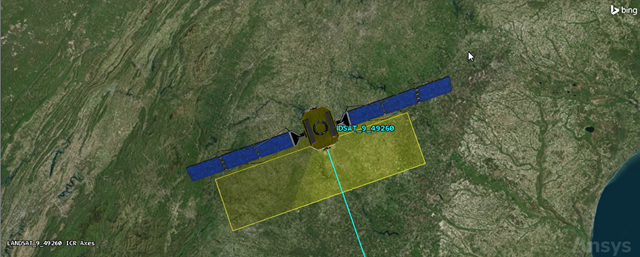
You should see a total of eight satellites listed with a TLE Epoch (UTC) of 1 Nov 2023 16:00:00.000.
Landsat 8 and Landsat 9 are the two newest operational Landsat satellites.
Listing of satellites with TLE Epoch (UTC) of 1 Nov 2023 16:00:00.000
Inserting the TDRS satellites
Insert the TDRS satellites and group them in another constellation.
- Select the following TDRS Satellites in the Common Name column of the search list of the Insert From Satellite Database dialog box:
- TDRS 12
- TDRS 3
- TDRS 6
- TDRS 7
- Select the Create Constellation from Selected check box in the Insert Options panel.
- Enter TDRS_Sats in the Name field.
- Click .
- Click to close the Insert From Satellite Database dialog box after the satellites have been propagated.
Modeling the Landsat satellites' cameras
The Landsat satellites used in this mission are equipped with optical
Creating a Sensor object for Landsat 8
Insert a Sensor object and attach it to the Landsat 8 satellite.
- Insert a Sensor (
 ) object using the Define Properties () method.
 - Select LANDSAT_8_39084 in the Select Object dialog box.
- Click .
- Select the Basic - Definition page when the Properties Browser opens.
- Open the Sensor Type drop-down list.
- Select Rectangular.
- Enter the following in the Rectangular panel:
- Click to accept your changes and to close the Properties Browser.
- Rename Sensor1 () Landsat8_Sens.
| Option | Value |
|---|---|
| Vertical Half Angle | 7.5 deg |
| Horizontal Half Angle | 2 deg |
Reusing the sensor object for Landsat 9
Both Landsat satellites are using the same camera model. You can copy the Landsat8_Sens Sensor object and paste it to LANDSAT_9_49260 so you don't the Landsat 9 sensor from scratch.
- Select Landsat8_Sens () in the Object Browser.
- Click Copy (
 ) in the Object Browser toolbar.
 - Select LANDSAT_9_49260 () in the Object Browser.
- Click Paste (
 ) in the Object Browser toolbar.
 - Rename Landsat8_Sens1 () Landsat9_Sens.
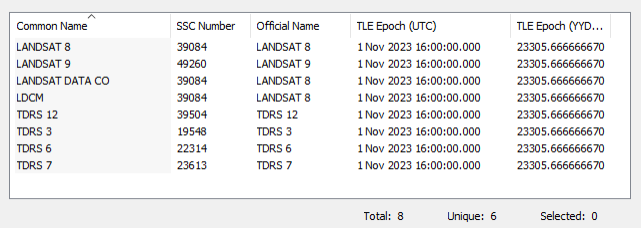
Viewing LANDSAT_9_49260 () in the 3D Graphics window
Review your changes in the 3D Graphics window.
- Bring the 3D Graphics window to the front.
- Zoom to LANDSAT_9_49260 () in the Object Browser.
- Use your mouse to get a general idea of LANDSAT_9_49260's () location and the field of view of Landsat9_Sens ().
LANDSAT_9_49260 Sensor Field of View
Grouping the cameras with a Constellation object
Insert a Constellation object to group the satellite cameras for analysis.
- Insert a Constellation () object using the Insert Default () method.
- Rename Constellation2 () CamerasFOV.
- Open CamerasFOV's () Properties ().
- Select the Basic - Definition page in the Properties Browser.
- Select the Sensor () check box in the Selection filter panel.
- Move () Landsat8_Sens () and Landsat9_Sens () from the Available Objects list to the Assigned Objects list.
- Click to accept your changes and to close the Properties Browser.
Creating a Chain object
A
Every object grouped in a Constellation object may be used to complete the chain, or only one of the objects therein.
Inserting a chain object
Start by inserting a Chain object into your scenario.
- Insert a Chain (
 ) object using the Insert Default () method.
 - Rename Chain1 () Colosseum_To_TDRSS.
Defining the start and end objects
Define the start and end objects in your chain, beginning with the Colosseum and ending with the TDRSS ground stations.
- Open Colosseum_To_TDRSS's () Properties ().
- Select the Basic - Definition page in the Properties Browser.
- Click the Start Object ellipsis (
 ).
). - Select Colosseum () in the Select Object dialog box.
- Click to close the Select Object dialog box.
- Click the End Object ellipsis ().
- Select TDRSS_Ground ().
- Click .
Creating the Chain object's connections
After you choose the start and end objects in your chain, you need to build the chain's connections. It doesn't matter in which order you place the connections in the Connections list; what matters is the From Object must be able to access the To Object.
- Click in the Connections panel.
- Click the From Object ellipsis ().
- Select Colosseum ().
- Click .
- Click the To Object ellipsis ().
- Select CamerasFOV ().
- Click .
Colosseum must pass through either Landsat8_Sens's or Landsat9_Sens's field of view to complete an access.
Creating the Chain object's second connection
When either Landsat8_Sens or Landsat9_Sens accesses Colosseum, it passes the image to its parent object.
- Click .
- Click the To Object ellipsis ().
- Select Landsat_Sats ().
- Click .
Creating the Chain object's third connection
The Landsat satellite will then pass the image to a TDRS satellite.
- Click .
- Click the To Object ellipsis ().
- Select TDRS_Sats ().
- Click .
Creating the Chain object's final connection
The TDRS satellite then passes the image to a TDRSS ground station.
- Click .
- Click the To Object ellipsis ().
- Select TDRSS_Ground ().
- Click .
- Click to accept your changes and to close the Properties Browser.
Constraining Access to Rome
The Landsat cameras will take pictures of the Colosseum during daylight hours. To model this, you need to impose a
- Open Colosseum's () Properties ().
- Select the Constraints - Active page.
- Click Add new constraints (
 ) in the Active Constraints toolbar.
 - Select Lighting in the Constraint Name list in the Select Constraints to Add dialog box.
- Click .
- Click to close the Select Constraints to Add dialog box.
- Open the drop-down list in the Lighting panel of the Constraint Properties.
- Select Penumbra or Direct Sun.
- Click to accept your changes and to close the Properties Browser.
Cleaning up the scenario
You will have an easier time seeing your chain accesses if you turn off the satellite ground tracks and orbits.
- Bring the 3D Graphics window to the front.
- Click Home View (
 ) in the 3D Graphics toolbar.
 - Zoom out until you see all the satellite orbits.
- Open Image_Relay's () Properties ().
- Select the 2D Graphics - Global Attributes page when the Properties Browser opens.
- Clear the following check boxes in the Vehicles panel:
- Show Ground Tracks/ Routes
- Show Orbits/ Trajectories
- Click to accept your changes and to close the Properties Browser.
You can still see the satellites, but the orbits and ground tracks have been removed.
Making labels visible at long distances
To improve your situational awareness, make your satellite and ground site labels visible at greater distances in the 3D Graphics window.
Editing the Satellite Objects' label detail
Set the
- Select all the Satellite () objects in the Object Browser.
- Click Properties () in the Object Browser toolbar.
- Select the 3D Graphics - Model page in the Properties Browser.
- Slide the All slider in the Detail Thresholds panel all the way to the right.
- Click to accept your changes and to close the Properties Browser.
You can hold the Ctrl key on your keyboard while clicking to select multiple satellites.
Editing the Facility Objects' label detail
Adjust the detail thresholds of the Facility objects.
- Select all the Facility () objects in the Object Browser.
- Click Properties () in the Object Browser toolbar.
- Select the 3D Graphics - Model page.
- Slide the All slider in the Detail Thresholds panel all the way to the right.
- Click .
Editing the Target Object's label detail
Maximize the viewing distance for the Target object's label.
- Open Colosseum's () Properties ().
- Select 3D Graphics - Model page.
- Slide the All slider in the Detail Thresholds panel all the way to the right.
- Click .
- Save () your scenario.
Generating a Complete Chain Access report
Generate a
- Select Colosseum_To_TDRSS () in the Object Browser.
- Select the Chain menu.
- Select Compute Accesses in the Chain menu.
- Right-click Colosseum_To_TDRSS () in the Object Browser.
- Select Report & Graph Manager... (
 ) in the shortcut menu.
 - Select the Complete Chain Access (
 ) report in the Installed Styles (
 ) directory in the Styles panel.
 - Click .
Setting animation time to first chain access
You can look at a complete chain access in the 2D or 3D Graphics windows. Use the 3D Graphics window.
- Right-click on the first access Start Time in the complete chain access report.
- Select Start Time in the shortcut menu.
- Select Set Animation Time in the Start Time submenu.
Complete Chain Access View
Now, you can view the complete chain access in the 3D Graphics window.
- Bring the 3D Graphics window to the front.
- Zoom to LANDSAT_9_49260 () in the Object Browser.
- Use your mouse so that you can see Landsat 9's view down to the ground.
- Click Home View () in the 3D Graphics toolbar.
- Zoom out until you can see the complete chain access.
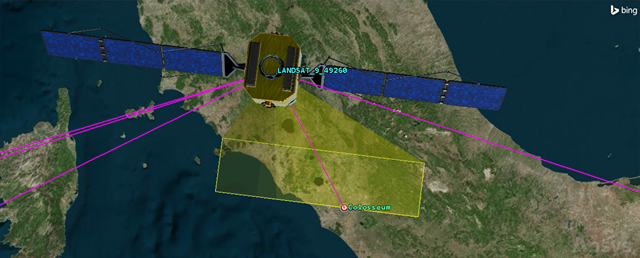
Colosseum to Landsat9 access
You can see the access from the Colosseum passing through Landsat9_Sens's field of view to LANDSAT_9_49260.
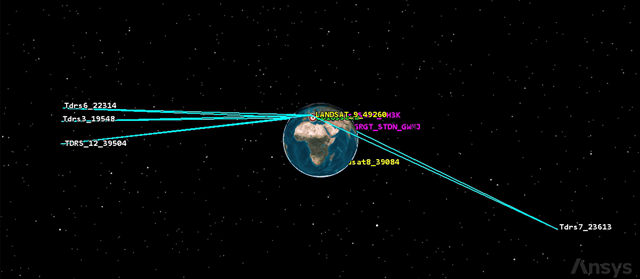
Complete Chain Access
Analyzing the complete chain access
This is an interesting complete chain access: engineers have their choice of which TDRS satellite and which TDRSS ground station to use at this particular time.
- Look at the 3D Graphics Window.
- Notice LANDSAT_9_49260 () has access to TDRS_3_19548 (), TDRS_6_22314 () and TDRS_12_39504 ().
- Notice also that LANDSAT_9_49260 () also has access to TDRS_7_23613 () which has access to Guam ().
- Return to the Complete Chain Access report.
- Close (
 ) the Complete Chain Access report when finished.
All three satellites have access to WhiteSands (![]() ).
).
Generating an Individual Strand Access report
An
- Return to the Report & Graph Manager.
- Select the Individual Strand Access () report in the Installed Styles () directory in the Styles panel.
- Click .
- Close () the Individual Strand Access report.
You can use the Individual Strand Access report to balance time lines against accuracy of assets. For example, using this report (or graph) would help you determine the impact on your mission should any of the satellites or ground stations become inoperable.
Configuring the chain to allow for multi-hopping
You saw in the Complete Chain Access report that there are multiple connections to choose from. Some operators may want to relay the image between satellites in the same constellation to permit downlinking in nearer real-time than what might otherwise be possible. In this instance, you want to multi-hop the images between the TDRS satellites in the TDRSS constellation.
To model multi-hopping through a Constellation object, you can configure a connection in the Chain object from the TDRS_Sats Constellation object to itself.
- Open Colosseum_To_TDRSS's () Properties ().
- Select the Basic - Definition page in the Properties Browser.
- Click in the Connections panel.
- Click the From Object ellipsis ().
- Select TDRS_Sats ().
- Click .
- Click the To Object ellipsis ().
- Select TDRS_Sats ().
- Click .
- Click to accept your changes and to keep the Properties Browser open.
Viewing the accesses in the 3D Graphics window
Your accesses will change dramatically, since all possibilities of a TDRS satellite accesses another TDRS satellite have now been calculated.
- Bring the 3D Graphics window to the front.
- Click Home View () in the 3D Graphics toolbar.
- Zoom out until you can see the complete chain access.
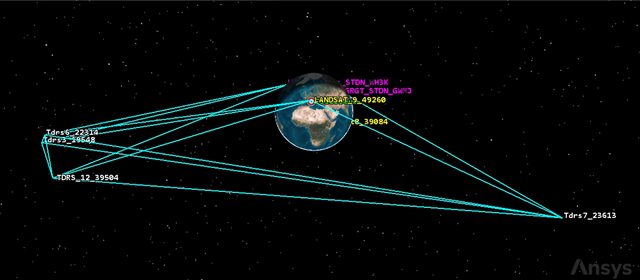
Updated Complete Chain Access
You can compare this view with the original complete chain access view. Now you are seeing all possibilities of the image being passed between TDRS satellites before it is passed to a TDRSS ground site.
Generating a Valid Paths report
A
- Bring the Report & Graph manager to the front.
- Select the Valid Paths () report in the Installed Styles list.
- Click .
Generating a Computed Strands report
A
- Bring the Report & Graph Manager to the front.
- Select the Computed Strands () report in the Installed Styles list.
- Click .
- Look at the Number of Strands (for example, 32) at the top of the report.
- Return to Colosseum_To_TDRSS's () Properties ().
- Select the Basic - Definition page.
- Look at Maximum # of Uses in the Connections panel.
There's a lot of information in the report detailing each possible strand.
The current value defaults to 1. This specifies the maximum number of times a connection may be used in a strand. When you generated the Computed Strands report, it reported how many strands there were based on all of your possible connections being used once.
Increasing the maximum number of strands in the TDRS constellation
To better simulate multi-hopping with the TDRS constellation, you can increase the maximum number of hops through itself. In this case, you will increase the strands per node from one to two in the TDRS satellite constellation.
- Select the TDRS_Sats to TDRS_Sats connection in the Connections list.
- Enter 2 in the Maximum # of Uses field.
- Click to accept your change and to keep the Properties Browser open.
- Bring the Computed Strands () report back to the front.
- Click Refresh (F5) (
 ) in the report toolbar.
 - Look at the Number of Strands value.
You created more possibilities (for example, 80 total) by increasing the number of strands allowed in this connection.
Determining the Optimal Strands
The Chain
Determining the shortest strand
You want to find the shortest possible strand.
- Return to Colosseum_To_TDRSS's () Properties ().
- Select the Basic - Strand Analysis page.
- Set the following options:
- Click to accept your changes and to keep the Properties Browser open.
- Bring the 2D Graphics window to the front.
- Zoom out until you see the whole Earth.
| Option | Value |
|---|---|
| Compute | Selected |
| Metric | Distance |
| Strand Comparison | Min |
You can see a highlighted strand. This is the strand containing the shortest distance between nodes in which to transfer the image to a TDRSS ground station.
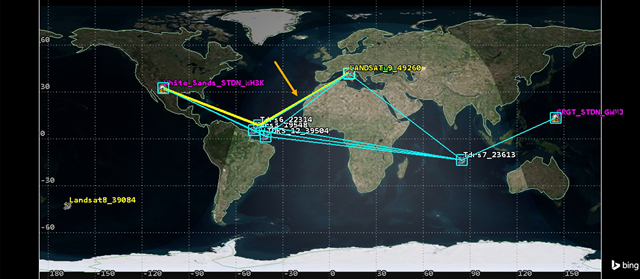
Optimal strand minimum distance
Determining the longest strand
You want to find the longest possible strand.
- Return to Colosseum_To_TDRSS's () Properties ().
- Select Max as the Strand Comparison value.
- Click to accept your change and to keep the Properties Browser open.
- Bring the 2D Graphics window to the front.
You can see a highlighted strand. This is the strand containing the longest distance between nodes in which to transfer the image to a TDRSS ground station.
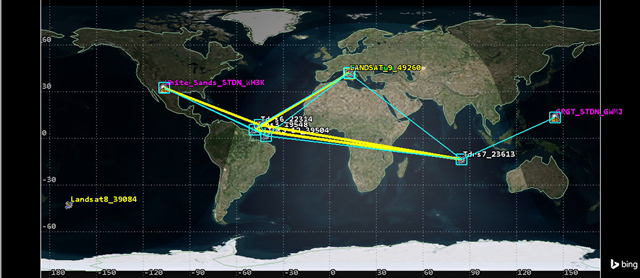
optimal strand maximum distance
Generating Optimal Strand reports
There are two reports you can use to determine your optimal strand: Optimal Strand at Time and Optimal Strands by Time. These aren't the only reports you can use, but these will suffice for the purposes of this analysis/
Generating an Optimal Strand at Time report
The
- Return to Colosseum_To_TDRSS's () Properties ().
- Select Min as the Strand Comparison value.
- Click to accept your change and to keep the Properties Browser open.
- Bring the Report & Graph manager to the front.
- Select the Optimal Strand at Time () report in the Installed Styles list.
- Click .
- Look at the data contained in the report.
The report is based on minimal distance at time.
Generating an Optimal Strands by Time report
The
- Bring the Report & Graph manager to the front.
- Select the Optimal Strands by Time () report in the Installed Styles list.
- Click .
- Look at the data contained in the report.
The report is similar to the Optimal Strand at Time report but it breaks down the data by each individual access.
Modeling the processing delay time
Processing delay is a noticeable latency due to the speed of light when sending data to and from satellites and the distance between the satellites. The speed of light is constant, but other delays could be caused by the hardware and software in every device that the signal must pass through. The default
- Open to LANDSAT_9_49260's () Properties ().
- Select the Basic - Chains Analysis page in the Properties Browser.
- Enter 5 sec in the Processing Delay Time field.
- Click to accept your change and to close the Properties Browser.
- Open Colosseum_To_TDRSS's () Properties ().
- Select the Basic - Strand Analysis page in the Properties Browser.
- Select the Processing Delay option.
- Click to accept your change and to close the Properties Browser.
Accounting for processing delay in reports
The Optimal Strand at Time report is showing the optimal strand based on minimum distance. Refreshing the report will change it to optimal strand based on maximum processing delay.
- Bring the Optimal Strand at Time report to the front.
- Click Refresh (F5) () in the report toolbar.
- Look at the data in the report.
Notice that when LANDSAT_9_49260 (![]() ) is sending an image, it is now showing the added five-second delay. The Optimal Strands by Time report takes the light time delay into account as well.
) is sending an image, it is now showing the added five-second delay. The Optimal Strands by Time report takes the light time delay into account as well.
Saving your work
You can clean up and finish your scenario.
- Close any open reports, properties, and the Report & Graph Manager.
- Save () your work.
Summary
The purpose of this scenario was to determine when you can take pictures of the Colosseum, in daylight, over a three-week analysis period, and send them to select TDRSS ground stations in near real-time, including a processing delay. You started by using a Target object as an aiming point for the Colosseum. Next, you loaded two Facility objects modeling the TDRSS ground stations, Guam and White Sands. You grouped them into a Constellation object. You inserted two operational Landsat satellites, grouped them into a Constellation object, and used Sensor objects to simulate the fields of view of the cameras on the satellites. You grouped the Sensor objects into Constellation object for analysis. Next, you inserted four operational TDRS satellites and grouped them into a Constellation object. You constrained the Colosseum so that any Sensor object accessing it could only do so in direct or partial sunlight. You inserted a Chain object, which allowed you to determine when near-real-time accesses were possible during your three-week analysis period. You found that access was possible when a Landsat camera's field of view passed over the Colosseum, the Landsat satellite had access to a TDRS satellite, and the TDRS satellite had access to a TDRSS ground station. Finally, you configured your Chain object to allow for multi-hopping s between TDRS satellites and added a processing delay to your analysis.