2D Scatter Plot
The 2D Scatter Plot displays an X-Y plot of variables in the model. The Data Explorer stores values for all variables in a model and special variables from the trade study, such as the objective function for the Optimization Tool. Any variable in the Model can be plotted against any other variable.
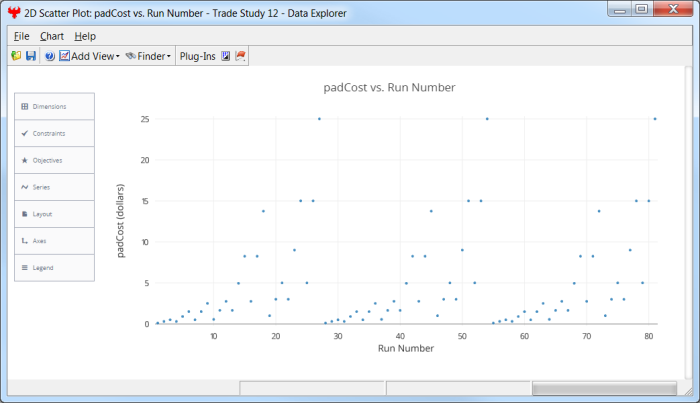
To configure a plot, select from the Plot Options menu on the left side of each plot:
- Dimensions - set which variable is displayed on which axis
- Constraints - specify upper and lower limits on design variables
- Objectives - set weighted values for design variables
- Series - set options for the plot display
- Layout - control global layout options for the overall plot area
- Axes - set options for the axes
- Legend - set the display and appearance of the plot legend
You can also use the View Controls toolbar, in the upper right of the plot area, to specify some settings.
See Also: Data Explorer