Contour Plot
The Contour Plot measures the effects of 2 independent variables on a given variable, but does so in a 2D fashion, using color to represent the range of values the dependent variable is in, like a topographical map.
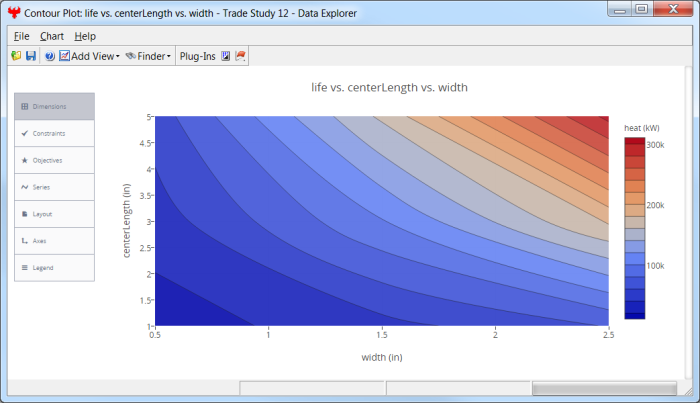
To configure a plot, select from the Plot Options menu on the left side of each plot:
- Dimensions - set which variable is displayed on which axis
- Constraints - specify upper and lower limits on design variables
- Objectives - set weighted values for design variables
- Series - set options for the plot display
- Layout - control global layout options for the overall plot area
- Axes - set options for the axes
- Legend - set the display and appearance of the plot legend
You can also use the View Controls toolbar, in the upper right of the plot area, to specify some settings.
See Also Data Explorer