Sensitivity Summary Plot
The Sensitivity Summary allows visualizing how much the design variables influence each of the responses. The summary also shows a few statistics for each response including bounds, mean, standard deviation, and reliability.
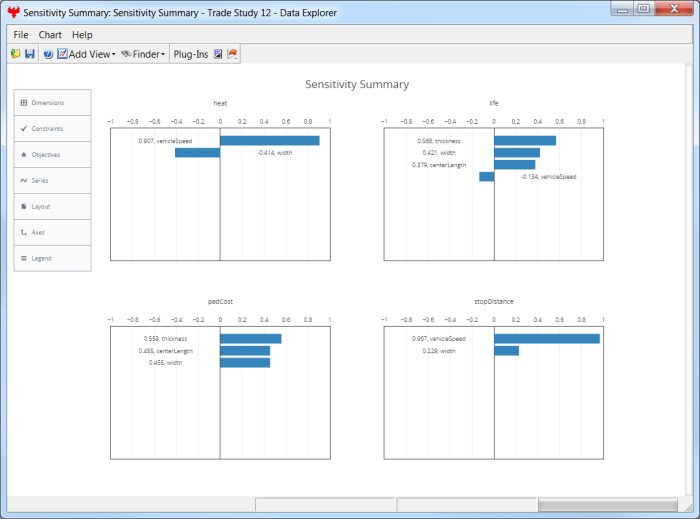
To configure a Sensitivity Summary, select from the tabs in the left-hand menu:
- Dimensions - set which variable is displayed on which axis
- Constraints - specify upper and lower limits on design variables
- Objectives - set weighted values for design variables
- Series - set options for the plot display
- Layout - control global layout options for the overall plot area
- Axes - set options for the axes
- Legend - set the display and appearance of the plot legend
Settings
To configure the Sensitivity Summary Plot, select the Plot Settings option from the toolbar in the upper right of the graph:
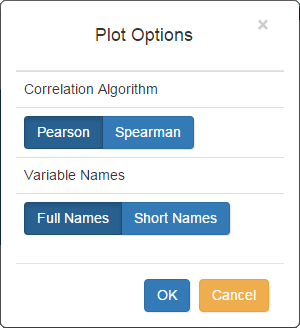
The first option is for which analytical method to use in calculation correlation:
- Pearson - Pearson is a standard parametric method for calculating correlation.
- Spearman - Spearman is a correlation method based on rank ordering of the samples.
For more information on these methods please refer here.
The second option determines how the variable names are shown in the graph:
- Full Names - Shows the full name of the variable, e.g. Model.pad.padCost
- Abbreviated Groups - Shows the first letter of each group before the final, e.g. M.p.padCost
See Also Data Explorer