STK Professional
The results of the tutorial may vary depending on the user settings and data enabled (online operations, terrain server, dynamic Earth data, etc.). It is acceptable to have different results.
Watch the following video, then follow the steps below incorporating the systems and missions you work on (sample inputs provided).Will Terrain Obstruct My Ability to Detect a Low Flying Airborne Platform?
In this exercise you will use your STK expertise to define and assess a complex, practice scenario, and then model and analyze that problem. Upon completion, you will have had the opportunity to practice the following skills:
- Use a local terrain file (*.pdtt) for analysis and visualization.
- Create azimuth-elevation masks.
- Create a custom report.
- Import a previously constructed aircraft ephemeris file to model a cruise missile's flight.
- Assess the feasibility of using your current radar system's location using Place and Sensor objects to detect a low flying airborne platform.
Problem Statement
Military ground forces are planning to test a mobile tracking radar in the Pacific Northwest region of the United States. The planned location is in very mountainous terrain. Blue Force personnel are manning the main radar site also known as base camp. Red Force personnel will launch a simulated cruise missile towards the base camp. Blue Force intelligence has provided mission planners the flight data of the cruise missile. As part of the Blue Force mission planning team, you need to determine if the current radar location provides ample warning of the cruise missile based on terrain, line-of-sight, and field-of-view. You have two additional mobile tracking radars that can be used in the test. Should you consider extending your perimeter by setting up the additional radars in a selected, confined area?
Break It Down
- The main Blue Force tracking radar is located in mountainous terrain and cannot be relocated.
- Red Forces are going to launch a simulated cruise missile at the base camp where the main Blue Force tracking radar is located.
- Blue Force intelligence has provided flight data that will be programmed into the cruise missile.
- The cruise missile will employ terrain following with a programmed altitude of 200 meters AGL (height above ground level) and a cruise speed of approximately 500 miles per hour.
- All mobile radar tracking vehicles must use available roads to include little used dirt roads.
- Blue Forces require a minimum of two minutes to prepare a simulated intercept of the cruise missile.
Solution
Build an STK scenario that will help you determine the placement of Blue Force mobile tracking radars that can search for and track a Red Force cruise missile headed towards base camp. Using STK Pro and a terrain file of the area, determine if Blue Forces can detect the cruise missile using the current radar system's specified field-of-view, and assess whether additional radar locations would strengthen the system and provide the access coverage required by Blue Force troops to prepare an intercept.
Create a New Scenario
Create a new scenario with a run time of ten (10) minutes.
- Launch STK (
 ).
). - Click the Create a New Scenario (
 ) button.
 - Enter the following in the New Scenario Wizard:
- When you finish, click OK.
- When the scenario loads, click Save (
 ). A folder with the same name as your scenario is created for you in the location specified above.
 - Verify the scenario name and location and click Save.
| Option | Value |
|---|---|
| Name: | CruiseMissile_Detection |
| Start: | 1 Jan 2018 19:00:00.000 UTCG |
| Stop: | + 10 min |
Save Often!
Turn Off STK Terrain Server
Since you'll use a local terrain file for analysis and visualization, turn off STK Terrain Server.
- Open CruiseMissile_Detection’s () properties (
 ).
). - Browse to the Basic – Terrain page.
- Disable Use terrain server for analysis.
- Click OK.
Turn On a Local Terrain File
Add analytical and visual terrain from a local file. Microsoft Bing Maps can be used for imagery. However, imagery is not required.
- Bring the 3D Graphics window to the front.
- Click the Globe Manager (
 ) icon or click the View menu and select Globe Manager.
 - In the Globe Manager - Hierarchy Window, click the Add Terrain/Imagery (
 ) button in Globe Manager.
 - Click the ellipsis (
 ) button and navigate to <STK install folder>/Help/stktraining/imagery> (e.g. for STK 64-bit C:\Program Files\AGI\STK 11\Help\stktraining\imagery).
 - Select StHelens_Training.pdtt and click Open.
- When prompted Use Terrain for Analysis, click Yes.
Blue Force Radar Site
Start by inserting Place ( ) object which will simulate a fixed in place mobile radar at the main radar site location (base camp).
- Using the Insert STK Objects Tool (
 ) insert a Place () object using the Define Properties () method.
 - On the Basic - Position page, set the following:
- Click Apply.
| Option | Value |
|---|---|
| Latitude: | 46.2927 deg |
| Longitude: | -122.271 deg |
| Height Above Ground: | 10 ft (simulates the antenna height on the vehicle) |
Define an Azimuth-Elevation Mask
The AzElMask properties enable you to define an azimuth-elevation mask for the radar site.
- Select the Basic - AzElMask page and set the following:
- Click Apply.
| Option | Value |
|---|---|
| Use: | Terrain Data |
| Use Mask for Access Constraint | Enable |
Constrain the Radar Site's Field-of-View Range
The radar is able to track aircraft out to a range of fifty (50) kilometers. Again, you're not basing this scenario on an actual radar system, you are doing a quick analysis on how the terrain might affect the radar site's field-of-view.
- Select the Constraints - Basic page.
- In the Range field, enable Max: and set the value to 50 km.
- Click Apply.
Range is measured as the distance between the two objects (in this case between the Place object and the cruise missile). The other constraint that is being used is Line of Sight. For a Place object, Line of Sight models the ground as the ellipsoid passing through its ground position with the same surface normal vector as that of its central body ellipsoid shape. A facility, place, or target configured with non-zero height above ground may look downward from that height to its ground model.
Display the Azimuth-Elevation Mask
For situational awareness, you can visualize the Azimuth-Elevation Mask in both the 2D Graphics and 3D Graphics windows.
- Select the 2D Graphics - AzElMask page and set the following At Range properties:
- Click OK.
- Rename the Place () object Main_Radar.
- Bring the 3D Graphics window to the front.
- Right-click on Main_Radar () in the Object Browser and select Zoom To.
- Using your mouse, zoom out until you can see the visual representation of the Azimuth-Elevation Mask.
| Option | Value |
|---|---|
| Show | Enabled |
| Number of Steps: | 5 |
| Minimum Range: | Use Default |
| Maximum Range: | 50 km |
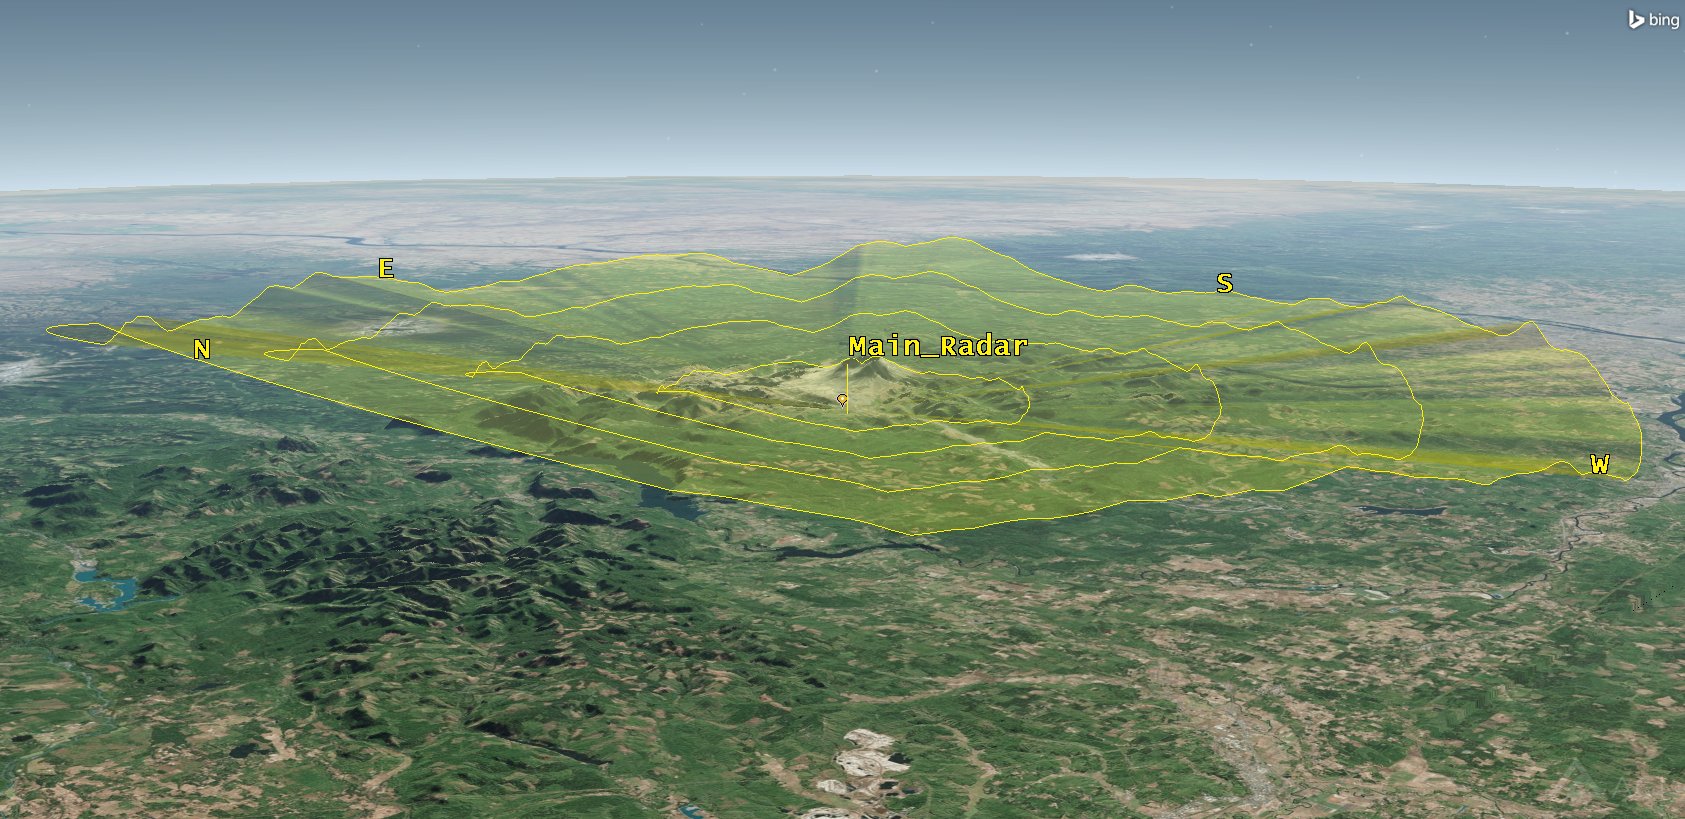
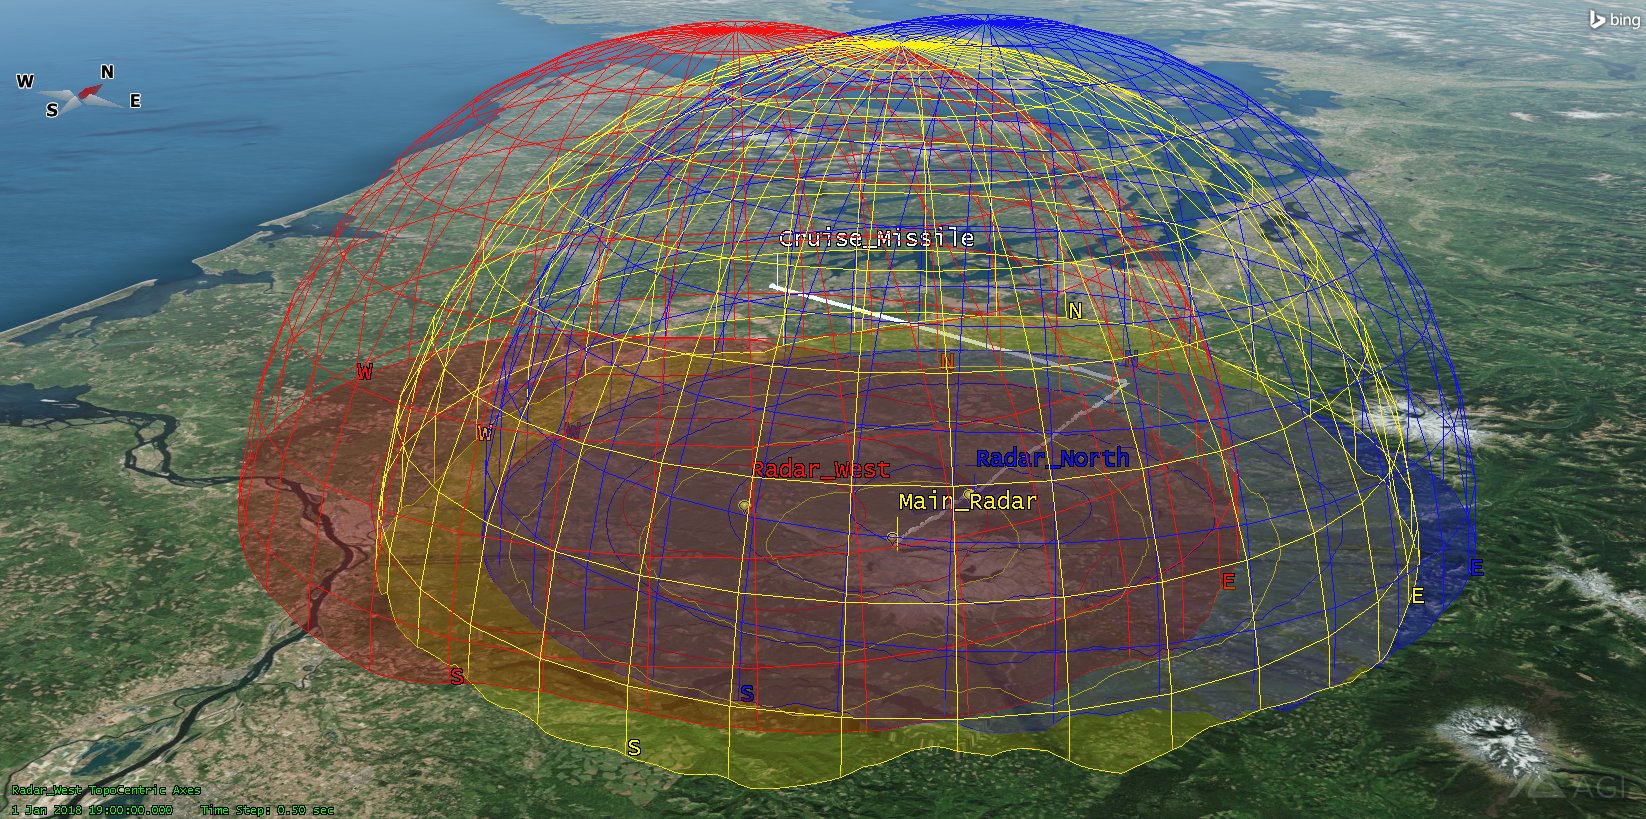
Main Radar Site Azimuth-Elevation Mask
Each ring represents a ten (10) kilometer range out to fifty (50) kilometers. Around the edge of the view, you can see indications of North (N), South (S), East (E), and West (W). The radar's field-of-view is poor to the north, east and southeast.
Enhance Situational Awareness with Sensors
The visual azimuth-elevation mask for the Place object gives you a good bottom field-of-view. Using a Sensor object can enhance this view by giving you a complete 3D Graphics representation in all directions (X, Y, Z). Analytically it's not required, but visually it'll win you points in a briefing. However, the Sensor object can be used analytically. Both the Sensor object and Place object "see" the same thing. They simply provide different graphical representations.
- Using the Insert STK Objects Tool () insert a Sensor (
 ) object using the Define Properties () method.
 - When the Select Object window appears, select Main_Radar () and click OK.
Sensor Type
You need a sensor that covers 360 degrees (basically a round bubble). You will use a Complex Conic sensor. Complex Conic sensor patterns are defined by the inner and outer half angles (vertical) and minimum and maximum clock angles (horizontal) of the sensor's cone.
- On the Basic - Definition page, change Sensor Type: to Complex Conic.
- Change the Half Angles Outer: value to 180 deg.
- Click Apply.
Apply Analytical Terrain and Range Constraints
Since the Sensor () object is subordinate to Main_Radar(), you simply "borrow" Main_Radar's () azimuth-elevation mask and apply it to the Sensor () object.
- Select the Constraints - Basic page.
- Enable Az-El Mask.
- In the Range field, enable Max: and set the value to 50 km.
- Click Apply.
Visualize the Constraints
The Sensor object is set up analytically. In order to see the constraints, instruct STK to apply them visually.
- Select the 2D Graphics - Projection page.
- Under Field of View, enable Use Constraints and click on AzElMask.
- Click Apply.
- Select the 3D Graphics - Attributes page.
- In the Projections field, change the % Translucency: value to 80.
- Click OK.
- Rename the Sensor () object "Main_RadarFOV".
- Bring the 3D Graphics window to the front.
- Right-click on Main_Radar() in the Object Browser and select Zoom To.
- Using your mouse, zoom out until you can see the visual representation of the Azimuth-Elevation Mask for both the Place () object and the Sensor () object.
In STK, making changes to an object's 2D Graphics properties applies the visual changes to both the 2D Graphics and 3D Graphics windows. If you make changes to 3D Graphics properties, they are only applied to the 3D Graphics window.
The "bottom" of the Sensor object conforms to the visual azimuth-elevation mask of Main_Radar. Increasing translucency makes it easier to see through the visual representation of both objects.
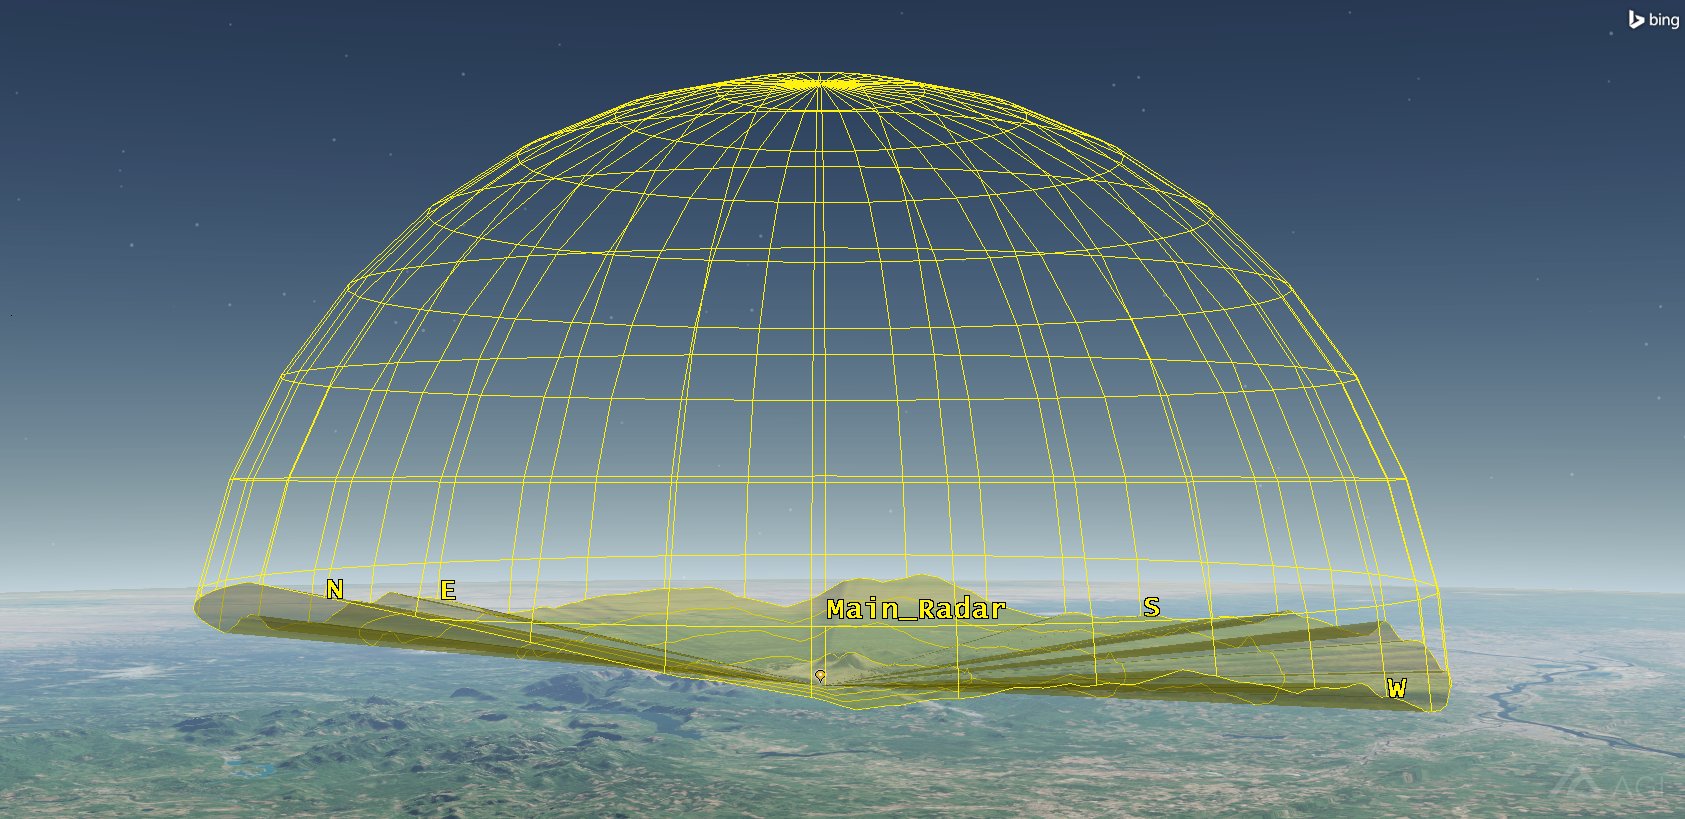
Place Object and Sensor Object Situational Awareness
STK Ephemeris Files
Blue Force intelligence has provided flight data that will be programmed into the cruise missile. Throughout the exercise, there is a possibility that red forces may launch cruise missiles from different directions. As this data is obtained, you would like to create external ephemeris files that can be quickly used depending on which flight route has been programmed into a particular cruise missile.
The StkExternal Propagator enables you to import the ephemeris for a vehicle directly from a file. You can create vehicle attitude or ephemeris data for all types of vehicles using the Export Ephemeris/Attitude tool. Basically, you create a flight route for an aircraft, export the flight route as an STK Ephemeris file, and save the file. Whenever that flight route is used, you can quickly import the ephemeris data back into STK.
For this part of the scenario, you will import a previously constructed Aircraft ( ) object ephemeris file in order to quickly build the cruise missile flight route.
Import the Cruise Missile Flight Route
The cruise missile will employ terrain following with a programmed altitude of 200 meters AGL (height above ground level) and a cruise speed of approximately 500 miles per hour. You have an ephemeris file containing the flight path of the Red Force's cruise missile. Apply the ephemeris file to an aircraft object () to simulate the Red Force cruise missile's flight path.
- Using the Insert STK Objects Tool () insert a Aircraft () object using the Define Properties () method.
- On the Basic - Route page, set the following:
- Click the Filename: ellipsis () button and navigate to the <STK install folder>/Help/stktraining/samples> (e.g. for STK 64-bit C:\Program Files\AGI\STK 11\Help\stktraining\samples).
- Select the file Missile_Route.e.
- Click Open.
- Turn on Overide the times contained in the file.
- Click OK.
- Rename the Aircraft () object "Cruise_Missile".
| Option | Value |
|---|---|
| Propagator: | StkExternal |
| Ephemeris Type: | STK Ephemeris |
If the ephemeris file was created during an earlier time period, pay attention to the Override the times contained in the loaded file selection. This allows you to specify the time of the first ephemeris point to your current scenario time period. To limit the span of external ephemeris available for analysis, select Limit ephemeris for analysis to the Scenario Interval. This ephemeris file was created on 1 Dec 2018. Your scenario start time is 1 Jan 2018 19:00:00.000 UTCG.
Change Your Perspective
- Bring the 3D Graphics window to the front.
- Right-click on Cruise_Missile () in the Object Browser and select Zoom To.
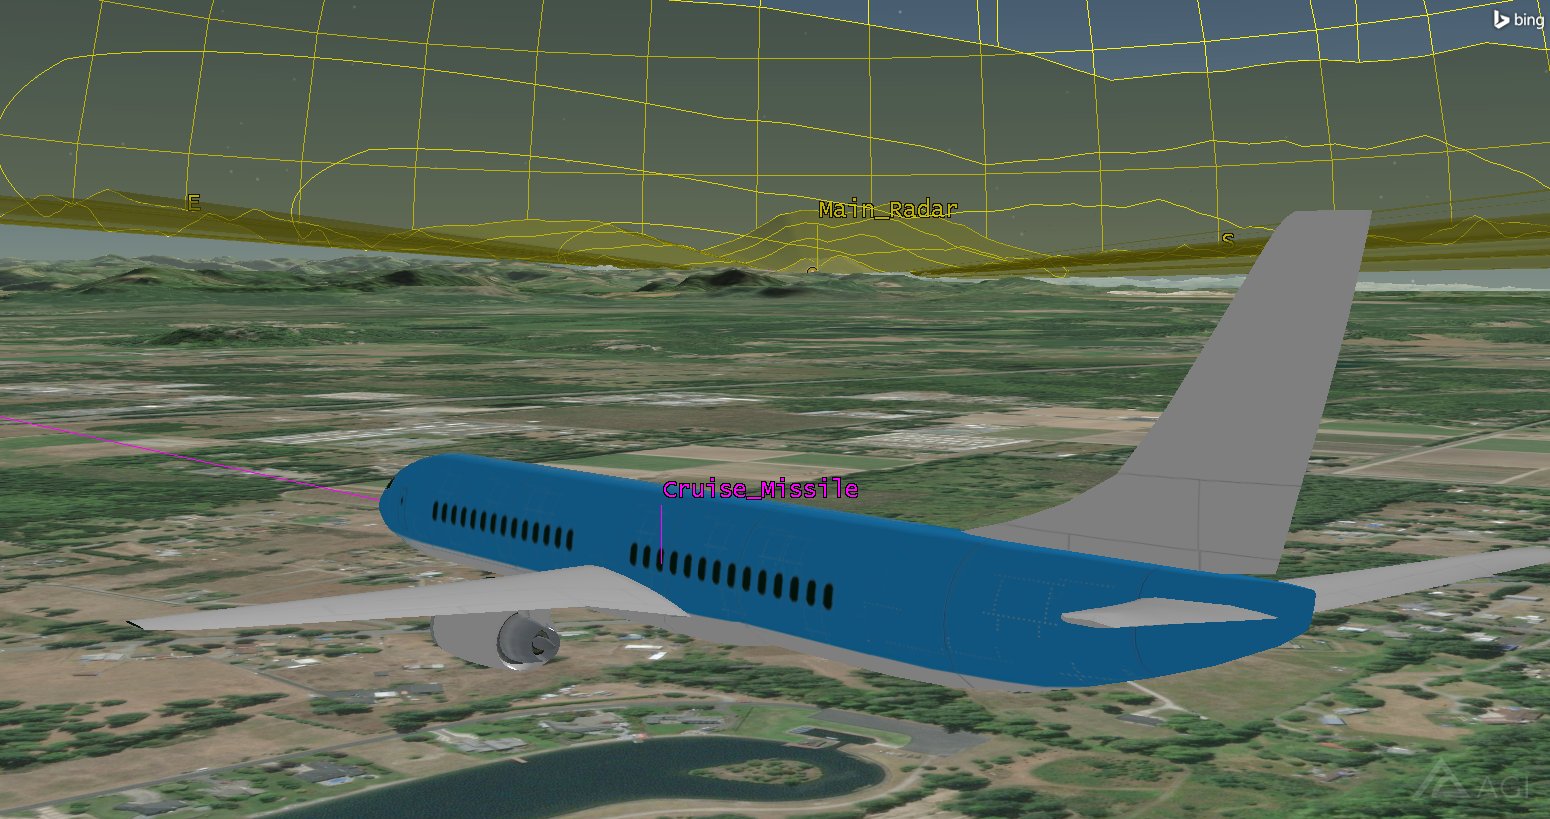
Cruise Missile with Default Model
Use a More Realistic Object Model
Cruise_Missile () is using the generic, default, missile model (aircraft.dae). Change it to a STK model that mimics an actual cruise missile.
- Open Cruise_Missile's () properties ().
- Select the 3D Graphics - Model page.
- Click the Model File: ellipsis button and navigate to the <STK install folder>(e.g. for STK 64-bit C:\Program Files\AGI\STK 11\STKData\VO\Models\Missiles).
- Select the AS15.mdl and click Open.
- Apply.
- Bring the 3D Graphics window to the front.
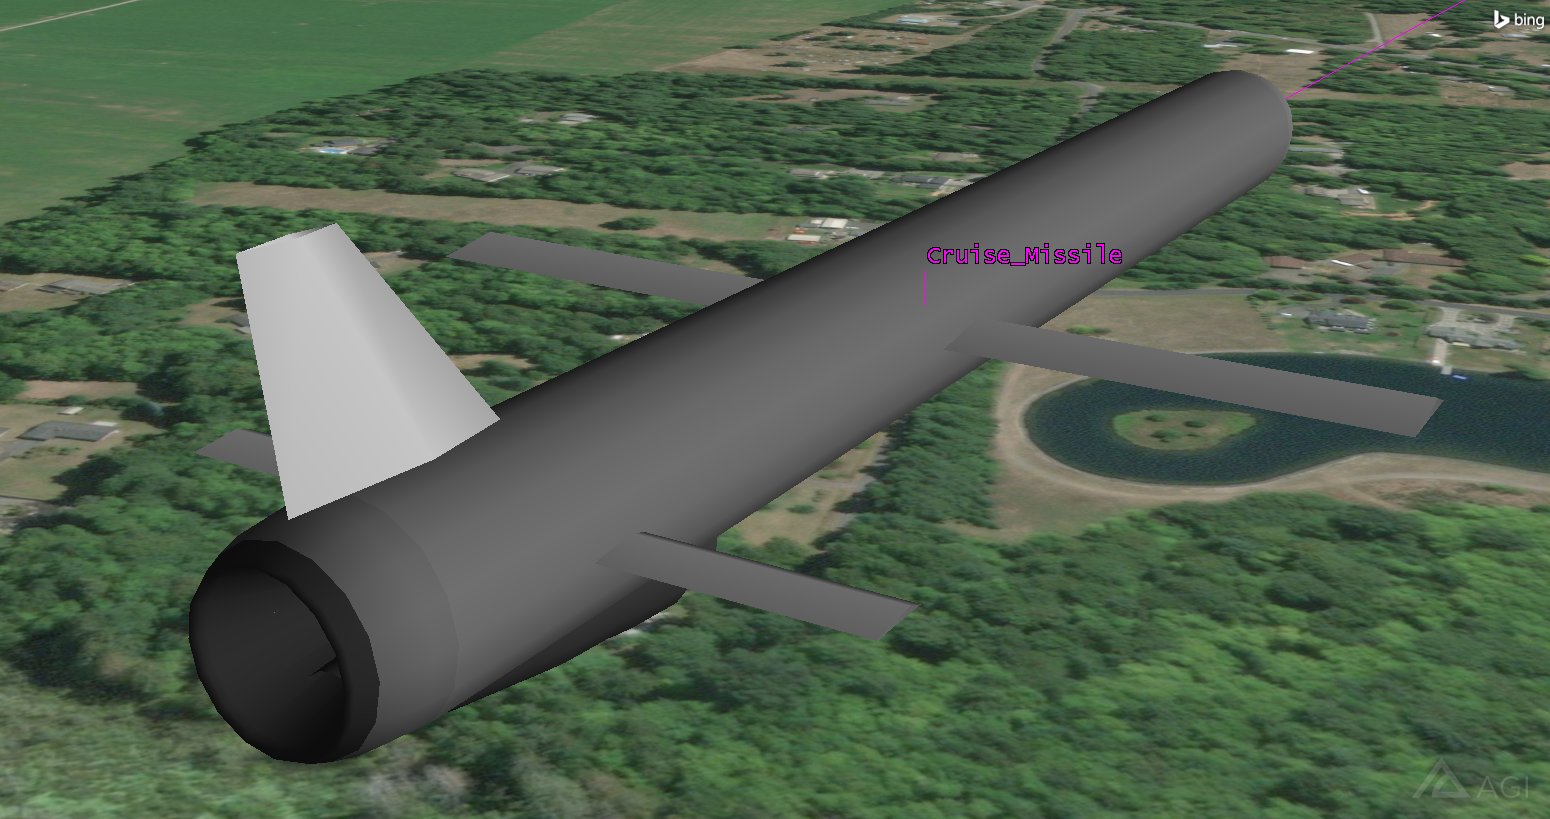
Cruise Missile with New Model
Drop Lines
To further enhance situational awareness and enhance visuals that can be used in a briefing, you can better visualize your flight route, following the terrain, as it travels along its trajectory using drop lines. Prior to including drop lines, you'll change the appearance of the air track.
- Return to Cruise_Missile's () properties ().
- Select the 2D Graphics - Attributes page.
- Change Color: to white.
- Change Line Width to the maximum thickness.
- Click Apply.
- Select the 3D Graphics - Droplines page.
- In the From Trajectory field, Terrain row, set the following:
- Click OK.
- Bring the 3D Graphics window to the front.
| Option | Value |
|---|---|
| Show | On |
| Interval | 1.0 sec |
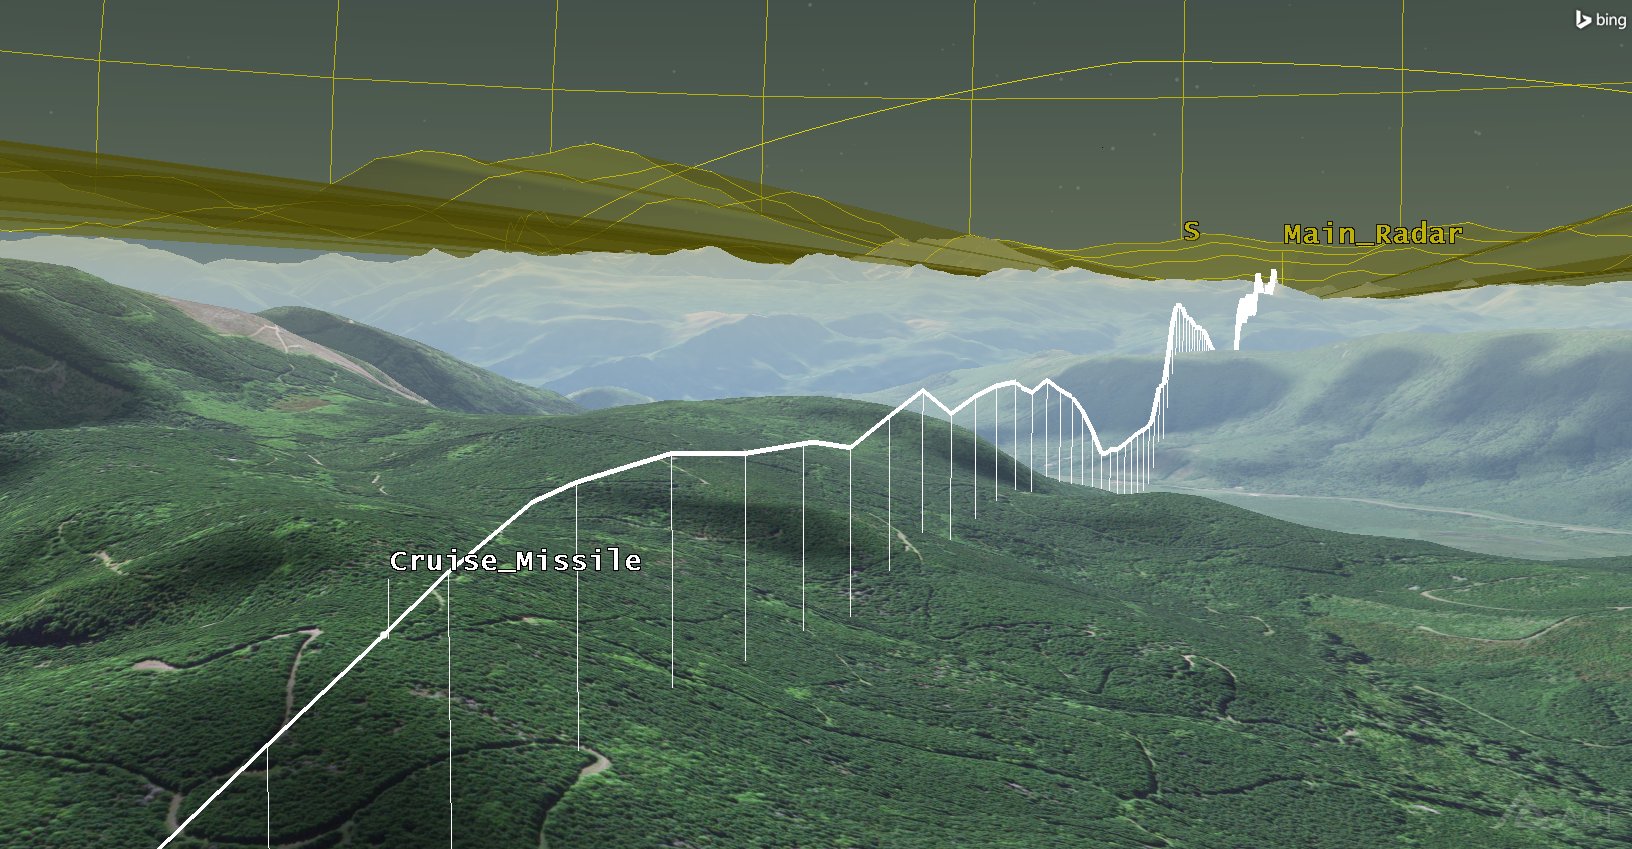
Cruise Missile Drop Lines
Tracking the Cruise Missile
As stated earlier, Main_Radar appears to have poor visibility in multiple directions. Take a look at Main_Radar () to obtain situational awareness on which direction Cruise_Missile () is coming from.
- Bring the 3D Graphics window to the front.
- Open the 3D Graphics window's properties ().
- Select the Annotation page.
- In the Compass field, change the following settings:
- Click OK.
- Zoom To Main_Radar().
- Mouse around in the 3D Graphics window to get a better view of Main_Radar() and Cruise_Missile ().
| Option | Value |
|---|---|
| Show | On |
| Y Origin: | Top |
| Radius: | 80 |
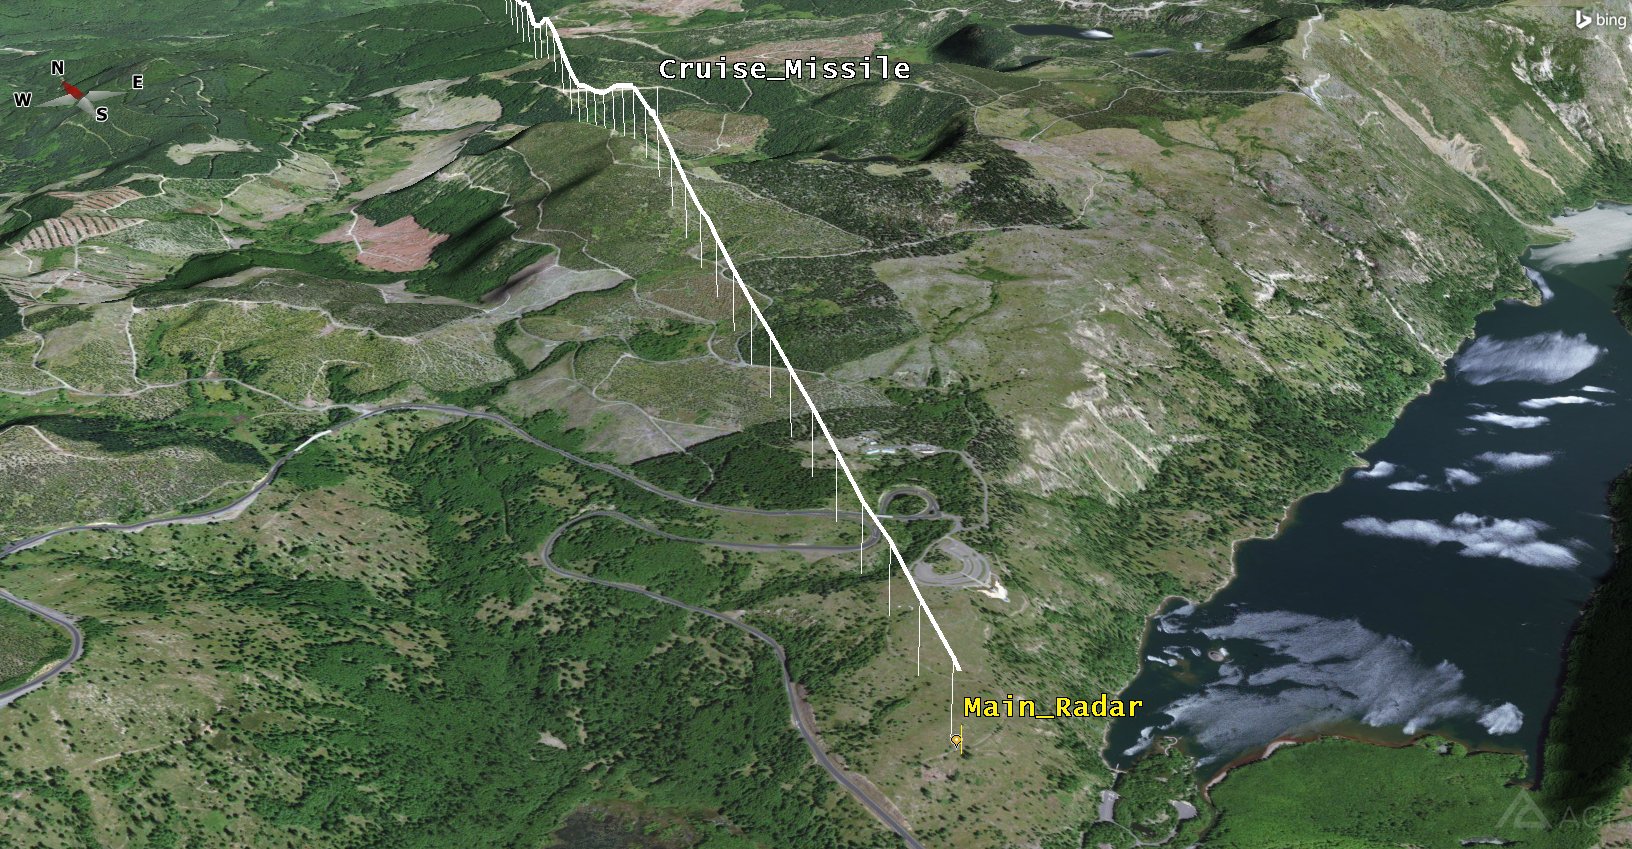
Cruise Missile and Main Radar Comparison
The compass is located in the upper left corner of the 3D Graphics window. The cruise missile appears to be coming from a northerly direction, but it appears that the main radar can see it. However, for how long?
Access Analysis
Your visualizations are complete. It's time to do some analysis. If you recall, Blue Forces require a minimum of two minutes to prepare an intercept of the cruise missile. Also, the cruise missile is flying at a speed of 500 miles per hour! Use the Access Tool to determine what time you begin tracking the cruise missile, for how long, and other pertinent data such as azimuth, elevation and range which are used for intercept purposes.
- In the Object Browser, right click on Main_Radar() and select Access.
- When the Access Tool opens, select Cruise_Missile () in the Associated Objects list.
- In the Reports field, click the Access button.
- Close the Access report.
Do the Blue Force ground troops have the required two (2) minutes to intercept the cruise missile?
Cruise Missile Location
You are using STK to make a preliminary analysis of whether or not your radar system can track the cruise missile. The analysis is solely based on a radar system's reported field of view (system specifications) due to the central body, in this case the Earth, and terrain. The access report shows that the radar will track the cruise missile for approximately eight (8) seconds prior to impact at the base camp. From which azimuth, elevation, and range does the system first pick up the cruise missile?
- Return to the Access Tool.
- In the Reports field, click the AER button.
- Use the AER report to answer the following questions:
- How close to Main_Radar() is Cruise_Missile () when it can first be tracked?
- Based on this data, is your perimeter secure with the existing system, or should more radar sites be added?
- Close the report and the Access Tool.
Extend Your Radar Coverage
The cruise missile is flying towards base camp from the north. Your location is vulnerable from that direction because terrain interference will allow a cruise missile to fly in virtually undetected. You need more protection.
The area of operations is very rugged and contains numerous dirt roads that are large enough to support the weight and size of the mobile radar vehicles. Being able to continuously track the cruise missile is the best case scenario. However, due to limitations on where the radar vehicles can be located, you've found two possible sites. You'll call one site "Radar North" and the second site "Radar West". All three sites are working as a small star topology communications system. Radar North and Radar West are in two way communications with the Main Radar. Therefore, if one site starts tracking the cruise missile, all three sites will work as a team to track and intercept the cruise missile.
Reuse Objects
Radar North and Radar West will be identical to Main Radar except for their positions. Copy the existing site, and use it as the model for the two new sites.
- Select Main_Radar() in the Object Browser.
- Click the Copy (
 ) button located in the Object Browser toolbar.
 - Select CruiseMissile_Detection () in the Object Browser.
- Click the Paste (
 ) button located in the Object Browser toolbar two (2) times.
Object Browser Toolbar
Now you should have three radar sites in your scenario (Main_Radar, Main_Radar1, and Main_Radar2). All three radar sites have the same properties. STK renames objects with a one up number. You need to reposition and rename the new radar sites. Main_Radar will remain at its original location.
Radar North
- If required, expand (
 ) Main_Radar1 () in the Object Browser.
 - Rename Main_Radar1 () "Radar_North".
- Rename MainRadar_FOV1 () "RadarNorth_FOV".
- Open Radar_North's () properties ().
- On the Basic - Position page, set the following:
- Click OK.
- Select both Radar_North () and RadarNorth_FOV () in the Object Browser using the Shift key or the Ctrl key and your left mouse button.
- Double-click one of the color icons and change the color so that it does not match Main_Radar() and MainRadar_FOV ().
| Option | Value |
|---|---|
| Latitude: | 46.4071 deg |
| Longitude: | -122.232 deg |
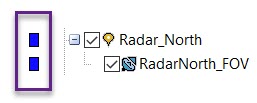
Color Icons
When multiple items are selected in the Object Browser, clicking on one of the color icons will allow you to choose the same color for all of them.
Radar West
- If required, expand () Main_Radar2 () in the Object Browser.
- Rename Main_Radar2 () "Radar_West".
- Rename MainRadar_FOV2 () "RadarWest_FOV".
- Open Radar_West's () properties ().
- On the Basic - Position page, set the following:
- Click OK.
- Select both Radar_West() and RadarWest_FOV () in the Object Browser using the Shift key or the Ctrl key.
- Double-click one of the color icons and change the color so that it does not match the other two sites.
- In the Object Browser, Zoom To Main_Radar().
- Bring the 3D Graphics window to the front.
- Use your mouse features to zoom out until you can see all three (3) radar sites.
| Option | Value |
|---|---|
| Latitude: | 46.298 deg |
| Longitude: | -122.492 deg |
All Radar Sites
With all three radars in such a concentrated area, your 3D Graphics window looks a little cluttered. Since the domes are being used simply to visualize the range of the radar, you can remove them visually so that they don't obstruct your view. If you choose to use them for analysis, they'll still be available.
Remove the Sensor Object Graphics
You can quickly remove the Sensor () object graphics using the check box located beside the object in the Object Browser.
- In the Object Browser, use the Ctrl key and the left mouse button to select all three (3) Sensor () objects.
- Uncheck one of the objects.
- Bring the 3D Graphics window back to the front.
When multiple items are selected in the Object Browser, on one (1) of the check boxes will disable all of them.
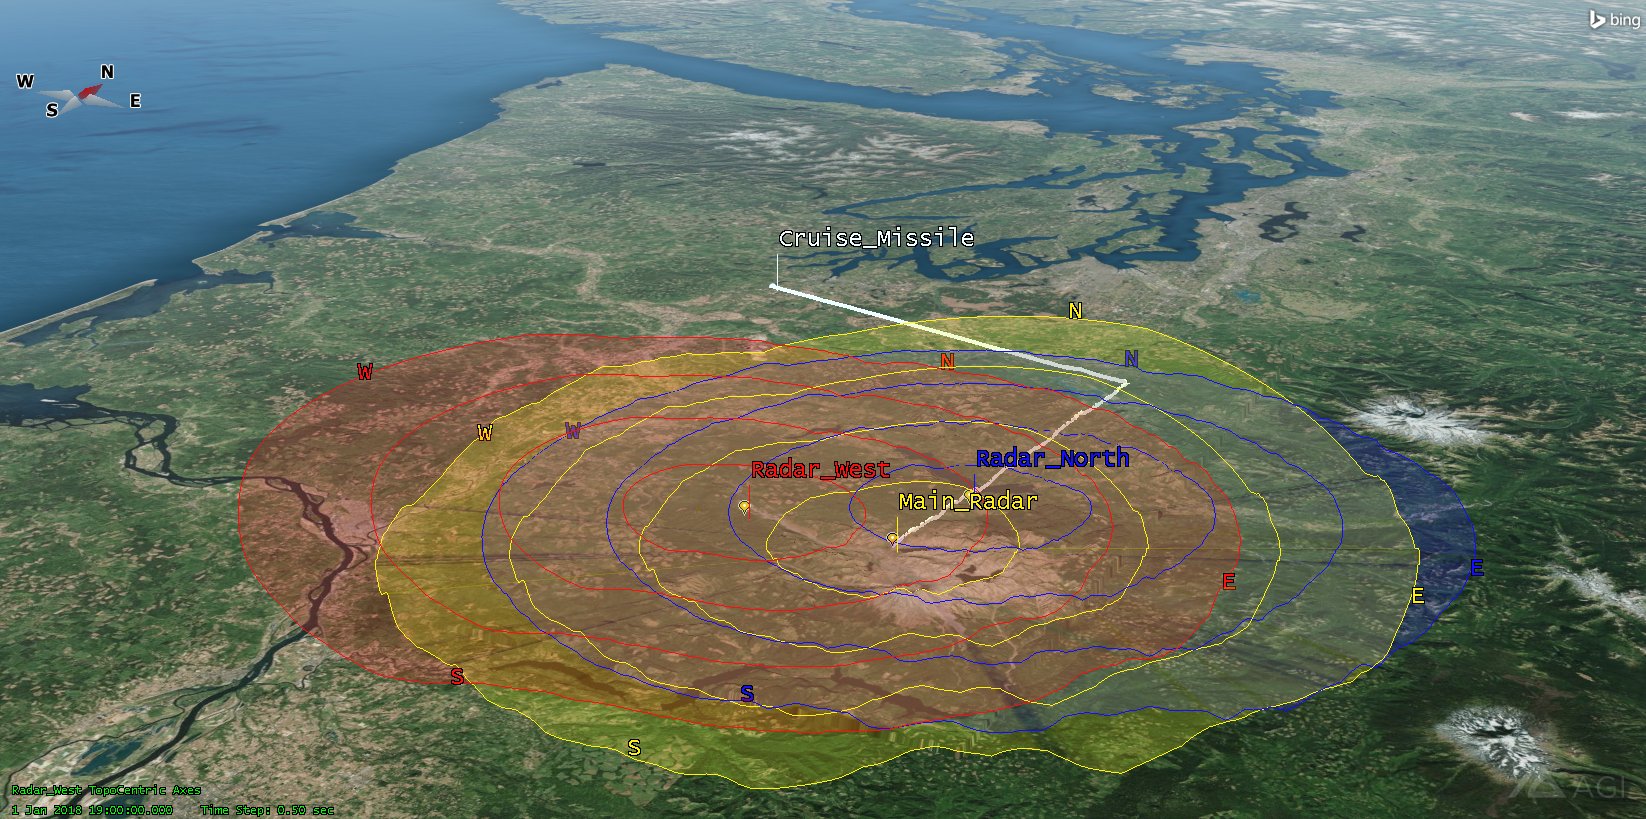
All Three Place Object's Azimuth-Elevation Masks
You have a good visual representation of which radar sites "might" see the cruise missile. Don't be fooled by this view. For instance, it would be easy to think that when the cruise missile turns south, Radar_North () can track it until it hits Blue Force base camp. Run further analysis and find out if this is the case.
Group the Radar Sites for Analysis
Your radar sites are now ready for analysis. You need to know when these sites can track the cruise missile. You could do individual access calculations from each of your three radar sites, but it will be easier to use a Constellation object to group the three sites and analyze them as a unit.
- Using the Insert STK Objects Tool () insert a Constellation (
 ) object using the Define Properties () method.
 - On the Basic - Definition page, use the Selection Filter: and select Place. This will highlight all the Place () objects in the Available Objects list.
- Click the right (
 ) arrow to move all three (3) Place () objects to the Assigned Objects list.
 - Click OK.
- Rename the Constellation () object "Radars".
Chains Calculate From Here to There
A chain is a list of objects (either individual or grouped into constellations) in order of access. In this case, the cruise missile is flying towards the Blue Force base camp and the radars.
- Using the Insert STK Objects Tool () insert a Chain (
 ) object using the Define Properties () method.
 - In the Available Objects list select Cruise_Missile.
- Click the right () arrow to move Cruise_Missile to the Assigned Objects list.
- In the Available Objects list select Radars.
- Click the right () arrow to move Radars to the Assigned Objects list.
- Click OK.
- In the Object Browser, rename the Chain () object "Missile_To_Radars."
Are Three Radars an Improvement?
One radar site did not provide enough warning for Blue Force troops. It is time to see if these two new radar sites added to the main radar site provide enough warning for an intercept.
- In the Object Browser, right click on Missile_To_Radars (), select Chain and click Compute Accesses.
- In the Object Browser, right click on Missile_To_Radars () and select Report & Graph Manager (
 ).
). - In the Installed Styles list, select the Complete Chain Access report style.
- Click the Generate button.
- Keep the report open.
Blue Force troops need two (2) minutes to prepare for an intercept of the cruise missile. Based on the report's Global Statistics, they have close to three (3) minutes of tracking time. However, one (1) of the radar sites actually acquires the cruise missile at 1 Jan 2018 19:04:38. The missile impacts Blue Force base camp at 1 Jan 2018 19:08:52. Therefore, Blue Force troops have slightly more than four (4) minutes to prepare for the interception of the cruise missile.
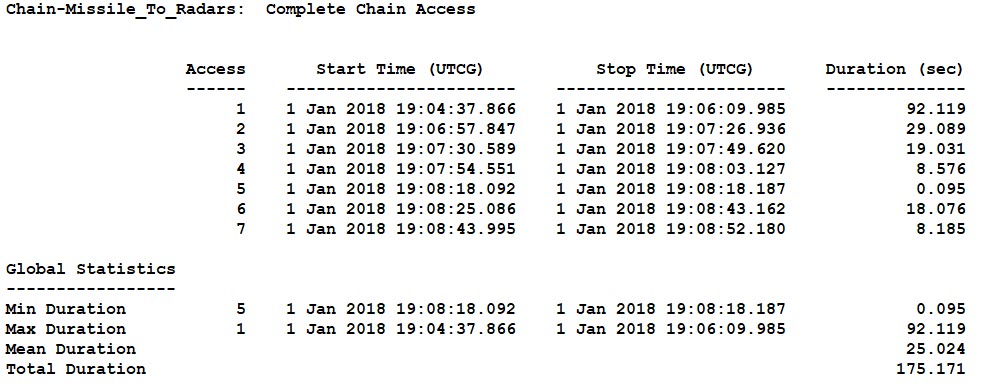
Complete Chain Access
The radar system begins tracking the cruise missile at 1 Jan 2018 19:04:37.866. If the radar system software has a built in dwell time, Blue Forces can predict, somewhat, where the cruise missile is headed after the radar loses its tracking as long as the cruise missile flies in a straight line. The cruise missile will still be seen by the radar operators until it's dropped by the system due to timing. Since the cruise missile is picked up multiple times after the initial track is established, this shouldn't be an issue. Since the last tracking time is 1 Jan 2018 19:08:52.180, the system can track the cruise missile approximately four minutes.
Main Tracking Radar
Find out which radar site tracks the cruise missile the longest. Still using the Report & Graph Manager (), create a graph that provide a quick view of which radar tracks the cruise missile the longest. The first tracking time is at 1 Jan 2018 19:04:37.866. The scenario start time is 1 Jan 2018 19:00:00.000 UTCG. If you generate the graph using default analysis times, there will be over four (4) minutes of space in the graph. Remove that space by changing Time Properties. You can copy and paste times from the Complete Chain Access report into the Time Properties section and make some minor time adjustments.
- Return to the Report & Graph Manager ().
- In the Time Properties field, make the following changes:
- In the Installed Styles list, select the Individual Strand Access (
 ) graph style.
 - Click the Generate button.
| Option | Value |
|---|---|
| Specify Time Properties | Enabled |
| Start: | Copy the first access time in the report and paste it into Start: (e.g. 1 Jan 2018 19:04:37.866) and subtract one second |
| Stop: | Copy the last access time in the report and paste it into Stop: (e.g. 1 Jan 2018 19:08:52.180) and add one second |
| Use step size/ time bound | Enabled |
| Step size: | 1 sec |
Subtracting one second for the start time and adding one second for the stop time places one second of white space at the beginning and end of the graph. Many users of STK decrease the Step size: time when creating graphs. For graphs that have vertical increases and decreases, lowering the Step size: usually creates a more rounded view of the graph line. In this instance, since the cruise missile is flying extremely fast, lowering the Step size: presents a more detailed view of radar accesses.
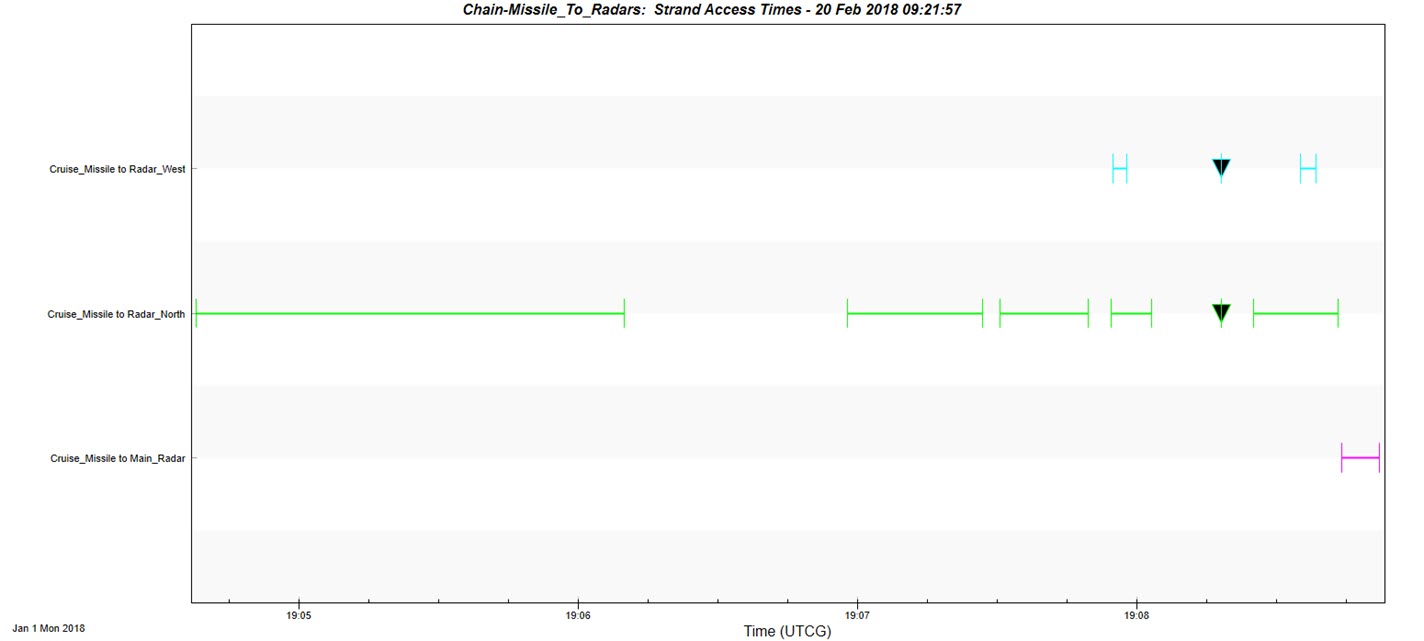
Individual Strand Access Graph
Based on the graph, Radar_North () is in the best position to pick up and track Cruise_Missile ().
Azimuth, Elevation and Range
The Complete Chain Access report provided the required information regarding tracking time to prepare an intercept. The next step is to know where to look. Time properties are set, so all you have to do is run another report called Access AER.
- Return to the Report & Graph Manager ().
- In the Installed Styles list, select the Access AER report style.
- Click the Generate button.
Cruise Missile Heading
You should determine if the tracking time is when the missile is flying south towards the base camp. This is important due to radar system dwell time. For instance, if Radar_North is tracking Cruise_Missile when it's flying on a heading other than towards Main_Radar (base camp), operators may have a dwell time track headed in a different direction providing false situational awareness to the radar network team. You are dealing with a Missile object. A simple custom report is required to determine its heading.
- Return to the Report & Graph Manager ().
- Change the Object Type: to Missile.
- Select Cruise_Missile ().
- In the Styles list, right click on My Styles, select New and then select Report.
- While in the rename mode, name the new report "Heading" and then click Enter. This will open Heading's properties.
- On the Content page, under Data Providers, remove the asterisk and enter heading.
- Click Filter.
- In the Providers list, expand () Heading and then Fixed.
- Select Time.
- Use the right arrow () to move Time to the Report Contents field.
- Select Azimuth.
- Use the right arrow () to move Azimuth to the Report Contents field.
- Click OK.
- In My Styles, select Heading.
- Click the Generate button.
If you exited the rename mode prior to opening Heading's properties, select Heading in My Styles and click the Properties icon in the Styles toolbar.

Styles Tool Bar
Based on the report, it appears that Radar_North () detects and begins tracking Cruise_Missile () when it's headed towards Main_Radar. More analysis could be done if there are other predetermined locations for Blue Force radar locations. However, based on the requirement of two (2) minutes to prepare an intercept of Cruise_Missile (), you've determined that the current radar network meets requirements.
Save Your Work
- Close all reports.
- Close the the Report & Graph Manager ().
- Save () your work.
 Visit AGI.com