Monte Carlo
Monte Carlo is a random sampling technique. It generates random values for the design variables based on the joint distribution of the design variables. The samples are then evaluated for computing response variable values. Since this is a random sampling technique if high enough number of evaluations are performed this method will give the most accurate results. The number of evaluations to generate a good probability estimate increases rapidly as the probability value under consideration decreases. Since Monte Carlo is a random sampling technique it can be used with non-smooth response functions, discrete design variables and discrete response variables. The histogram plot ignores failed runs while calculating mean, variance, skewness, kurtosis, etc.
Control Parameters
| Name | Default Value | Description |
|---|---|---|
| Runs | 1000 | This option controls the number of samples to be performed. |
| Seed | This is the seed for the random number generator. To replicate the results between different runs the seed value should be kept the same. |
Performing the Study using Monte Carlo
When the Probabilistic Analysis Tool is run by pressing the Run… button, it will repeatedly set the value for the design variables with a random value based upon their distribution and then validate each of the response variables. At each iteration it will store the values in the Model in a Data Explorer.
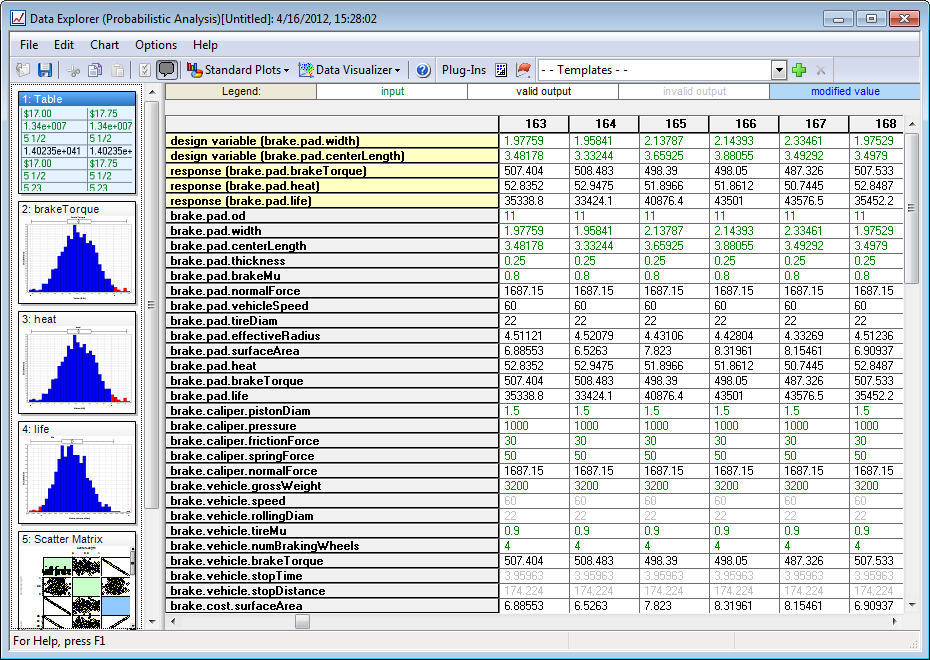
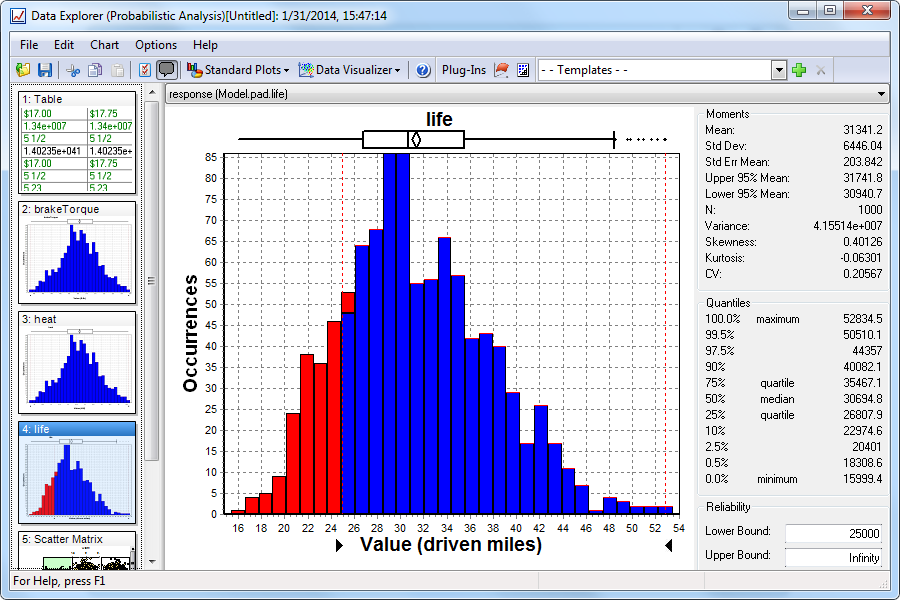
The Data Explorer can be used to view the Histogram of any variable. To view the Histogram of a given response variable, select the corresponding Histogram page on the left pane of the Data Explorer. The Histogram plot displays the distribution of a given variable, as well as relaying various statistics about that distribution, including mean, standard deviation, etc. Using the Histogram, it is also possible to set upper and lower bounds on acceptable values and get back a reliability statistic on how many runs produce results inside the bounds specified.
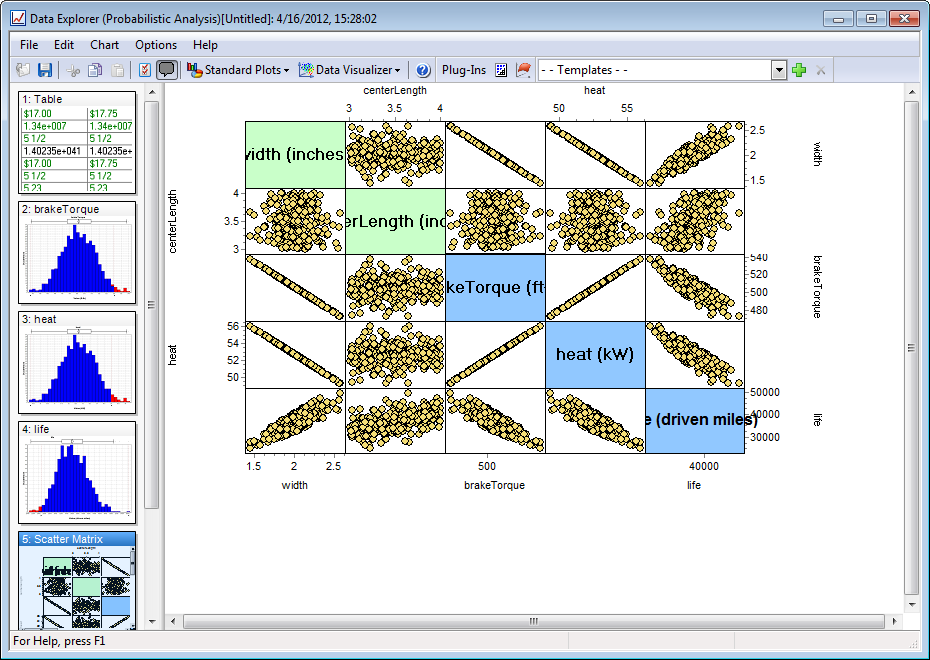
The Probabilistic Analysis Tool will also generate a Scatterplot Matrix page. The Scatterplot Matrix displays a grid of graphs that compare every design variable and response against every other design variable and response. This is useful for quickly getting a feel for the relationships between various variables in the study.
See Also Data Explorer | Histogram | Scatter Matrix