Series: Range/Bins
Return to Plot Options Menu | Series tab
Subtab menu: Mode | Range/Bins | Style | Error Bars | Color Bar | Color Bar Ticks
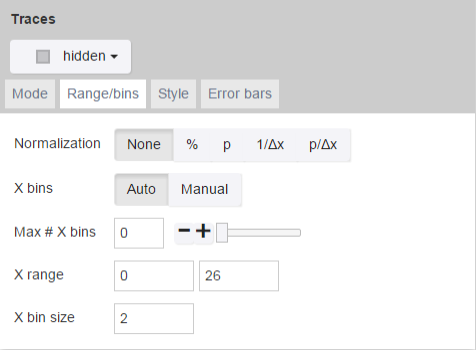
The Range/Bins tab is used to set the range and bin options for histogram and contour plots.
Some controls only appear for certain plots or with certain options selected.
| Control Name | Use/Options |
|---|---|
| Normalization | Sets the normalization scale.
|
| X bins | Selects how the X bins are determined.
|
| Max # X bins | Sets the maximum number of X bins. The number will be used in an algorithm that decides the optimal bin size.
|
| X range | Manually sets the range for the X bins.
|
| X bin size | Manually sets the size for the X bins.
|
| Y bins | Selects how the Y bins are determined.
|
| ...Max # | Sets the maximum number of Y bins. The number will be used in an algorithm that decides the optimal bin size.
|
| Y range | Manually sets the range for the Y bins.
|
| Y bin size | Manually sets the size for the Y bins.
|
| Contours | Sets how the contours are determined.
|
| ...Max # | Sets the maximum number of contour steps.
|
| ...Range | Manually sets the range for the contours.
|
| ...Size | Manually sets the step size between each contour level.
|
| Z range |
|
| Bin Function | Selects the function used to fill in the bin.
|
See Also Data Explorer