Series: Style
Return to Plot Options Menu | Series tab
Subtab menu: Mode | Range/Bins | Style | Error Bars | Color Bar | Color Bar Ticks
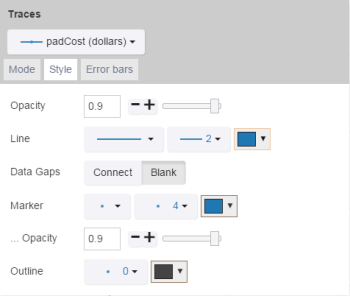
The Style tab is used to set more details about the plot display.
Some controls only appear for certain plots or with certain options selected.
| Control Name | Use/Options |
|---|---|
| Opacity | Change the opacity of the whole series.
|
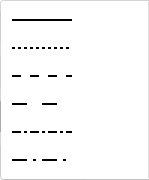
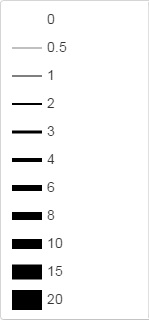
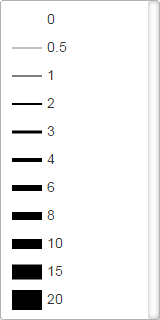
| Line | Sets the options for the line.
|
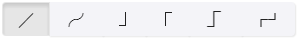
| Shape | Selects the way the line behaves between data points.
|
| Smoothing | Sets the smoothness of the line if line shape is curved/spline.
|
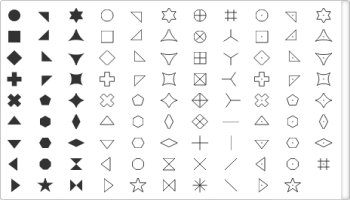
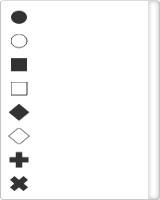
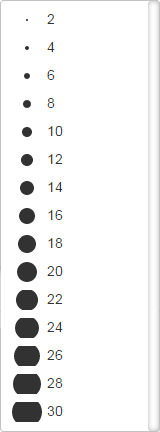
| Marker | Sets the marker options.
|
| ...Max # Displayed | Sets the maximum number of points that can be displayed on a plot.
|
| ...Opacity | Sets the opacity of the points on the plot. (Note that the higher-level Opacity field determines the maximum opacity allowed by this field.)
|
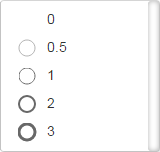
| Outline | Sets the outline for the marker.
|
| Auto Color | Sets if the auto-color is used.
|
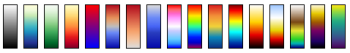
| Color bars | Selects the gradient color scale from the preset colors.
|
| Min/max color | Sets the min and max color on the color scale, as an alternate to the Color Bars.
|
| Scale | Determines the direction for the color scale when Auto Color is "On". This field does not affect manual color settings.
|
| Smooth color | Selects a smoothing algorithm for the data.
|
| Coloring | Determines the coloring method of the contour values.
|
| Lines | Determines if the contour lines are drawn.
|
| Bar Gap | Sets the distance between bars.
|
| Group Gap | Sets the distance between groups from multiple series.
|
| Data Gaps | Sets whether the data across gaps resulting from "not a number" (NaN) or missing values in the provided data arrays are connected.
|
| Box Gap | Sets the distance between boxes.
|
| Whisker Width | Sets the width of the whiskers relative to the box' width. For example, with 1, the whiskers are as wide as the box(es).
|
| Box Line | Sets the size of the box line.
|
| Suspected Outlier Color | Sets the color of the outlier markers.
|
See Also: Data Explorer