Series: Color Bar
Return to Plot Options Menu | Series tab
Subtab menu: Mode | Range/Bins | Style | Error Bars | Color Bar | Color Bar Ticks
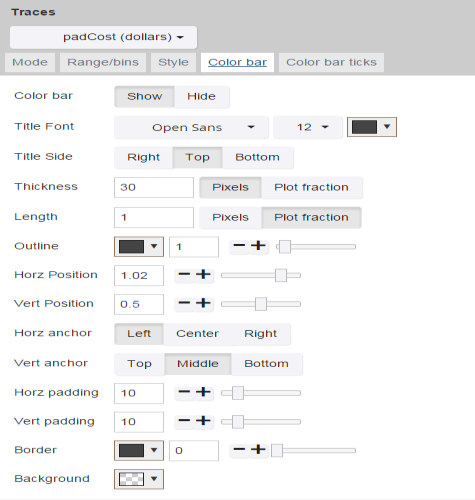
The Color Bar tab is used to set the display of the color bar.
Some controls only appear for certain plots or with certain options selected.
| Control Name | Use/Options |
|---|---|
| Color bar | Determines if the color bar is shown.
|
| Title Font | Sets the options for the color bar title text.
|
| Title Side | Sets the alignment for the color bar title.
|
| Thickness | Sets the thickness of the color bar.
|
| Length | Sets the length (height) of the color bar.
|
| Outline | Sets the outline around the color bar.
|
| Horz Position | Sets the horizontal position of the color bar.
|
| Vert Position | Sets the vertical position of the color bar.
|
| Horz anchor | Sets the color bar's horizontal position anchor.
|
| Vert anchor | Sets the color bar's vertical position anchor.
|
| Horz padding | Sets the horizontal padding around the color bar area. (Use with the Border field to see the effect.)
|
| Vert padding | Sets the vertical padding around the color bar area. (Use with the Border field to see the effect.)
|
| Border | Sets the border around the color bar area.
|
| Background | Sets the background color for the color bar area.
|
See Also Data Explorer