Axes: Labels
Return to Plot Options Menu | Axes tab
Subtab menu: Range | Lines | Ticks | Labels | Spikes | Layout
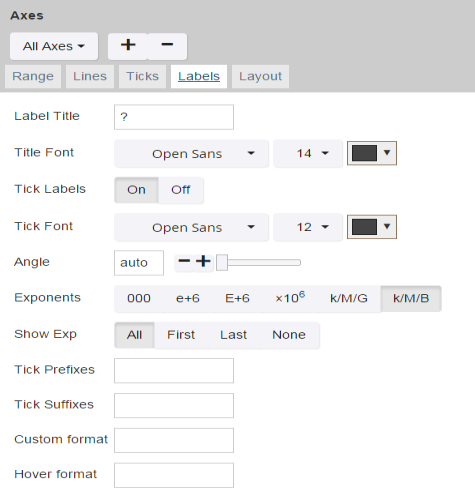
The Labels tab is used to set the display of the labels on the ticks.
Some controls only appear for certain plots or with certain options selected.
| Control Name | Use/Options |
|---|---|
| Title | Sets the name of the axis. Note that if "All Axes" is selected, this field will rename all axes.
|
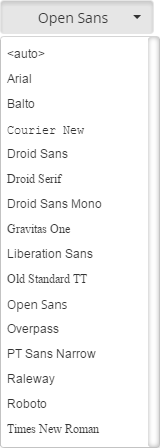
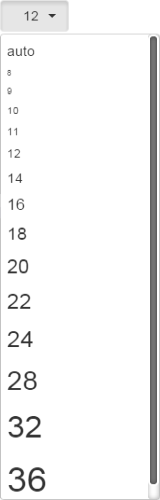
| Title Font | Sets the properties of the title font. Layout (tab) > Global Font and Title Font fields are at a higher level than the Title Font field here. If either of those is changed after this field is set, this field will update to match the change.
|
| Tick Labels | Turn on or off the data labels on the selected axis.
|
| Tick Font | Sets the properties of the tick font. Layout (tab) > Global Font and Title Font fields are at a higher level than the Tick Font field here. If either of those is changed after this field is set, this field will update to match the change.
|
| Angle | Sets the angle of the tick font.
|
| Exponents | Sets the format for exponents in ticks.
|
| Show Exp | Set how many exponents to display in ticks.
|
| Tick Prefixes | Set a prefix for the tick values.
|
| Tick Suffixes | Set a suffix for the tick values.
|
| Custom format | Sets the custom tick format.
|
| Hover format | Sets the format in the axis for how to display the data when the cursor is hovered over a data point.
|
Return to Plot Options Menu | Axes tab
Subtab menu: Range | Lines | Ticks | Labels | Spikes | Layout