Axes: Ticks
Return to Plot Options Menu | Axes tab
Subtab menu: Range | Lines | Ticks | Labels | Spikes | Layout
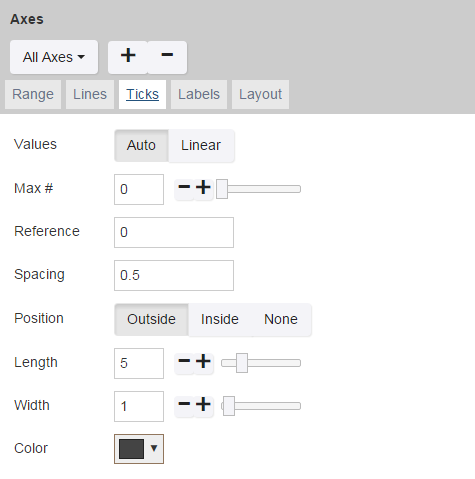
The Ticks tab is used to set the display of ticks along the axes.
Some controls only appear for certain plots or with certain options selected.
| Control Name | Use/Options |
|---|---|
| Values | Set the values for the ticks.
|
| Max # | Set the maximum number of ticks to show.
|
| Reference |
this field does not work with the "Auto" setting.
|
| Spacing |
this field does not work with the "Auto" setting.
|
| Position | Sets the position of the tick mark.
|
| Length | Sets the length of the tick mark.
|
| Width | Sets the width of the tick mark.
|
| Color | Sets the color of the tick mark.
|
Return to Plot Options Menu | Axes tab
Subtab menu: Range | Lines | Ticks | Labels | Spikes | Layout