Axes: Layout
Return to Plot Options Menu | Axes tab
Subtab menu: Range | Lines | Ticks | Labels | Spikes | Layout
The Layout tab is used to set the layout properties of an axis. This tab can only be used when a single axis is selected; that is, "X Axis," not "All Axes".
Some controls only appear for certain plots or with certain options selected.
| Control Name | Use/Options |
|---|---|
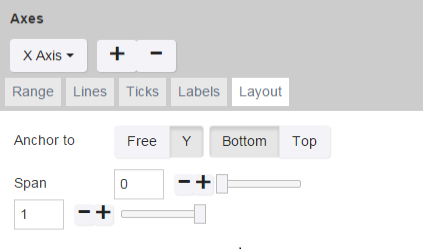
| Anchor to |
|
| Position | Sets the position of the selected axis, relative to the selected axis (that is, vertical position for the x axis; horizontal position for a y axis).
|
| Overlaying | Set whether the selected axis has an overlay and which axis to use.
|
| Span | Determine the span of the plot within the plot area.
Difference between minimum and maximum must be at least 0.01. |
Return to Plot Options Menu | Axes tab
Subtab menu: Range | Lines | Ticks | Labels | Spikes | Layout