STK Premium (Air), STK Premium (Space), or STK Enterprise
You can obtain the necessary licenses for this tutorial by contacting AGI Support at support@agi.com or 1-800-924-7244.
Required Capability Install: For versions 12.10 and earlier of the STK software, this lesson requires the installation of the EOIR capability. For these versions of the software, the EOIR installer is included in the STK Premium software download, but requires a separate installation process. Read the Readme.htm found in the STK software install folder for installation instructions. You can obtain the necessary install by visiting https://support.agi.com/downloads or calling AGI support.
This lesson requires STK 12.9 or newer to complete in its entirety. If you have an earlier version of STK, you can complete a legacy version of this lesson.
The results of the tutorial may vary depending on the user settings and data enabled (online operations, terrain server, dynamic Earth data, etc.). It is acceptable to have different results.
Capabilities covered
This lesson covers the following capabilities of the Ansys Systems Tool Kit® (STK®) digital mission engineering software:
- STK Pro
- Electro-Optical Infrared Sensor Performance (EOIR)
Problem statement
Engineers, operators, and analysts require a way to quickly and easily model the tracking of objects in space from other spacecraft. Such space-to-space surveillance missions can be challenging, as the objects form comparatively small targets against the cosmic or atmospheric background. You need to surveil and track a satellite in a geostationary orbit (GEO) from a satellite in low Earth orbit (LEO) using an on-board electro-optical infrared sensor. You want to evaluate the total tracking duration as well as other sensor-to-target metrics, taking into account minimum measures of performance, against which intervals of tracking are deemed to be successful.
Solution
Use the STK software to propagate a satellite in LEO and a second satellite in GEO. Then, use the Electro-Optical Infrared Sensor Performance (EOIR) capability to model the LEO satellite's on-board sensor to generate a visual sensor scene to confirm GEO falls within the sensor's field of view. Then, obtain signal-to-noise ratio (SNR) data during your analysis period from the EOIR sensor model. Finally, impose a constraint on the data to limit access intervals to periods above a certain SNR floor representing the probability of detection.
What you will learn
Upon completion of this tutorial, you will understand how to do the following:
- Use the EOIR capability to create a space-to-space observation system
- Verify a target falls within a sensor's field of view
- Create custom EOIR reports and graphs
- Use EOIR sensor constraints in your analyses
Creating a new scenario
First, you must create a new STK scenario, and then build from there.
- Launch the STK application (
 ).
). - Click
 Create a Scenario in the Welcome to STK dialog box.
 - Enter the following in the STK: New Scenario Wizard:
- Click when you finish.
- Click Save (
 ) when the scenario loads.
 - Verify the scenario name and location in the Save As window.
- Click .
| Option | Value |
|---|---|
| Name | LEO_GEO_EOIR |
| Start | Default |
| Stop | Default |
The STK application creates a folder with the same name as your scenario for you.
Save () often during this lesson!
Modeling the satellites
Your scenario consists of two satellites in notional orbits. Insert two
Inserting the GEO satellite
The main focus of your analysis will be a satellite in GEO, which you need to target and track.
- Bring the Insert STK Objects tool (
 ) to the front.
 - Select Satellite (
 ) in the Select An Object To Be Inserted list.
 - Select Orbit Wizard (
 ) in the Select A Method list.
 - Click .
- Open the Type drop-down list when the Orbit Wizard opens.
- Select Geosynchronous.
- Enter GEO in the Satellite Name field.
- Click to confirm your changes, propagate GEO (), and close the Orbit Wizard.
A satellite in a stationary orbit will remain fixed in the sky above the specified fixed longitude.
Inserting the LEO satellite
Insert a second a satellite in LEO orbit to track GEO. You don't need any specific orbit for this mission; the default circular orbit will suffice.
- Insert a Satellite () object using the Orbit Wizard () method.
- Leave Circular selected for the Type.
- Enter LEO in the Satellite Name field when the Orbit Wizard opens.
- Click to confirm your changes, propagate LEO (), and close the Orbit Wizard.
Circular orbits have a constant radius.
Modeling LEO's EOIR sensor
The
Before you can generate an EOIR sensor scene and obtain sensor-to-taget data, you must first create a Sensor object and specify the
Inserting a Sensor object
Attach a
- Bring the Insert STK Objects tool () to the front.
- Insert a Sensor (
 ) object using the Insert Default () method.
 - Select LEO () when the Select Object dialog box opens.
- Click to confirm your selection and to close the Select Object dialog box.
- Right-click on Sensor1 () in the Object Browser.
- Select Rename in the shortcut menu.
- Rename Sensor1 () LEO_Sensor.
Selecting the EOIR sensor type
Select the EOIR sensor type on the sensor's
- Right-click on LEO_Sensor () in the Object Browser.
- Select Properties (
 ) in the shortcut menu.
 - Select the Basic - Definition page.
- Open the Sensor Type drop-down list.
- Select EOIR.
Setting the sensor's spatial properties
By default, an EOIR sensor is set up with a single band. Select the Spatial tab on the Definition page to specify the spatial properties for each band.
The EOIR properties used in the lesson are notional.
- Select the Spatial tab.
- Note that Field-of-View and Number of Pixels is selected as the Input method by default.
- Enter the following parameters in the Field of View panel:
- Note the Number of Pixels defaults to 128 in each dimension.
- Click to confirm your changes and to keep the Properties Browser open.
| Option | Value |
|---|---|
| Horizontal Half Angle | 1.5 deg |
| Vertical Half Angle | 1.5 deg |
The EOIR capability uses these half angles to determine the full angular extent of the sensor's FOV.
Viewing the sensor's spectral properties
Specify the sensor's
- Select the Spectral tab.
- Confirm Low is set to 0.400 (um) in the Spectral Band Edge Wavelengths panel.
- Confirm High is set to 0.700 (um) in the Spectral Band Edge Wavelengths panel.
Setting the sensor's optical properties
Next, specify the sensor's optical properties by choosing which two optical parameters will serve as the inputs used to calculate a third parameter.
- Select the Optical tab.
- Open the Input drop-down list.
- Select F-Number and Entrance Pupil Diameter.
- Enter the following values in the Field of View panel:
- Click to confirm your changes and to keep the Properties Browser open.
| Option | Value |
|---|---|
| F/# | 2.00 |
| Entrance Pupil Diameter | 400 |
The Entrance Pupil Diameter is measured in centimeters.
Setting the sensor's radiometric properties
The sensor's radiometric properties define its energy measurement properties.
- Select the Radiometric tab.
- Enter 1e-19 in the EquivalentValue cell in the Sensitivity panel.
- Select the Enter key.
- Leave all other parameters as the defaults.
- Click to confirm your change and to keep the Properties Browser open.
The sensitivity defines the "noise floor" of the sensor; the sensor will not detect signals below this level. The EquivalentValue is for Noise Equivalent Irradiance/Radiance (NEI/NER) vs. Integration Time (the time interval over which a radiant signal is collected before generating an image). To maintain realism, the EOIR capability applies the quantization noise to the NEI/NER dark noise when you are not simulating quantization.
Targeting GEO
After the field of view has been defined, it is time to point the sensor and track GEO. The Targeted pointing type causes the sensor to point to other objects in the scenario.
- Select the Basic - Pointing page.
- Open the Pointing Type drop-down list.
- Selected Targeted.
- Select GEO () in the Available Targets list.
- Move (
 ) GEO () to the Assigned Target list.
 - Click to confirm your changes and to close the Properties Browser.
Establishing baseline access metrics
While you can calculate sensor-to-target metrics using the EOIR capability without computing access, you first want to understand how frequently, and for how long, LEO_Sensor can access GEO. These computations are a good starting point for the remainder of your analysis.
Computing access
Use the
- Right-click on LEO_Sensor () in the Object Browser.
- Select Access... (
 ) in the shortcut menu.
 - Select GEO () in the Associated Objects list when the Access tool opens.
- Click
 .
.
Creating an Access report
Generate an Access report as a baseline for your target analysis.
- Click in the Reports panel.
- Note the number of accesses (for example, 15) as well as the Total Duration (for example, approximately 51,400 seconds) when the Access report opens.
While an Access report gives you a good idea when LEO_Sensor can see GEO, it does not show you how what the target satellite looks like in its field of view.
Setting the Animation time
Set your current scenario time to a point when LEO_Sensor has access to GEO.
- Right-click on the Start Time of the first Access in the report.
- Select Start Time in the shortcut menu.
- Select Set Animation Time in the Start Time submenu.
- Close (
 ) the Access report.
 - Click to close the Access tool.
Opening the EOIR toolbar
To
- Select View in the Menu Bar.
- Select Toolbars in the View menu.
- Select EOIR in the Toolbar submenu to show the EOIR toolbar (
 ).
).
Adding GEO to the EOIR configuration
To see LEO_Sat in the EOIR sensor scene, you must first select it as a target in the
- Click EOIR Configuration... (
 ) on the EOIR toolbar.
 - Select Satellite/GEO () in the Available STK Objects list when the EOIR Configuration dialog box opens.
- Move (
 ) Satellite/GEO () to the Selected Targets list.
 - Click to confirm your selection and to close the EOIR Configuration dialog box.
Setting GEO's EOIR shape
When you include an object as a target in the EOIR configuration, you can then specify the EOIR properties for that object. For Satellite objects, you can select shapes and specify corresponding dimensions to represent them, as well as temperature and material data (which together create a thermal model of the spacecraft) by updating their
- Open GEO’s () Properties ().
- Select the Basic – EOIR Shape page when the Properties Browser opens.
- Note Sphere is selected for the Shape.
- Set the following parameters:
- Leave Gray Body selected for the Material.
- Leave all other parameters set to their defaults.
- Click to confirm your changes and to keep the Properties Browser open.
| Option | Value |
|---|---|
| Radius | 5 m |
| Temperature | 6000 K |
An EOIR sensor will take images of objects in the Selected Targets List that both fall within its field of view and are sufficiently bright, either in reflected light or from self-radiance, at wavelengths that the sensor can detect. A quick way to
The Gray Body material type does not represent any real material, but it is useful for setting up test situations.
Verifying GEO is in LEO_Sensor's field of view
Confirm LEO_Sensor can see GEO by generating an EOIR sensor scene. Target satellites can appear in an EOIR sensor scene during the interval between their orbit start and stop times.
Viewing the sensor geometry in the 3D Graphics window
First, view LEO_Sensor's targeting of GEO in the 3D Graphics window.
- Bring the 3D Graphics window to the front.
- Right-click on GEO () in the Object Browser.
- Select Zoom To in the shortcut menu.
- Use your mouse to set your view so that you can see LEO_Sensor targeting GEO.
- Click Start (
 ) on the Animation toolbar.
 - Watch as GEO moves to the center of LEO_Sensor's field of view, if it not already.
- Click Pause (
 ) when GEO is in the center of LEO's field of view.
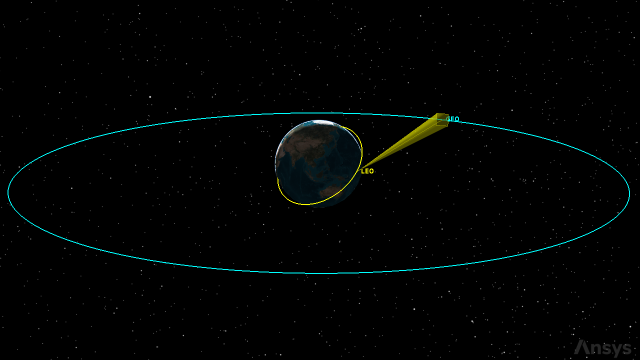
LEO Sensor targeting geo
While GEO falls well within LEO_Sensor's field of view, it does not tell you what the view from the sensor actually looks like. Gain a better understanding by generating an EOIR sensor scene.
Generating an EOIR sensor scene
- Select LEO_Sensor () in the Object Browser.
- Click EOIR Sensor Scene... (
 ) on the EOIR toolbar.
 - Review the sensor scene when the EOIR Sensor Scene window opens.
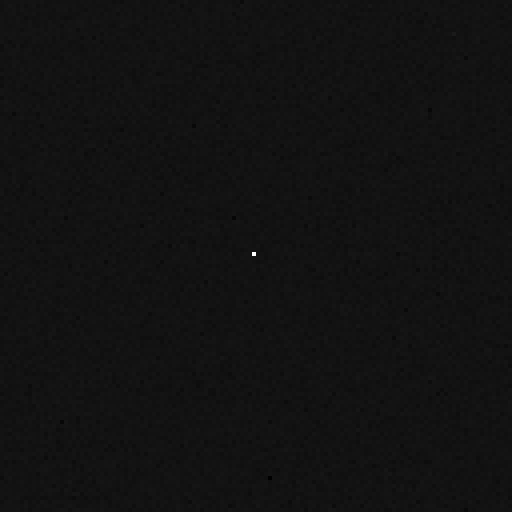
GEO CONFIRMED in LEo_Sensor's FOV
The
Updating the EOIR sensor scene
Change GEO's EOIR Shape properties to lower its temperature.
- Return to GEO's () EOIR Shape Properties ().
- Enter 500 K in the Temperature field.
- Click to confirm your change and to close the Properties Browser.
- Bring the EOIR Sensor Scene window to the front.
- If you do not see any changes, close the EOIR Sensor Scene window and click EOIR Sensor Scene... () on the EOIR toolbar.
- Review the changes.
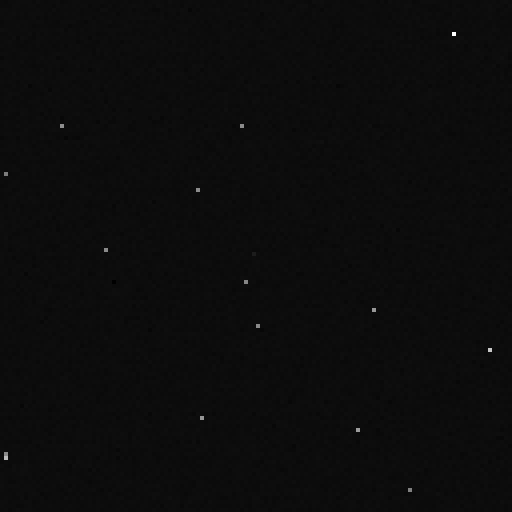
GEO at Lower Temperature in LEo_Sensor's FOV
Creating a custom EOIR graph
The EOIR capability does more than simulate scenes created by an EOIR sensor. It can also calculate metrics a sensor would receive from a target's signal. Use the available
Creating a custom graph style
Create a new custom graph style called EOIR SNR.
- Right-click on LEO_Sensor () in the Object Browser.
- Select Report and Graph Manager... (
 ) in the shortcut menu.
 - Select the My Styles (
 ) folder in the Styles panel when the Report & Graph Manager opens.
 - Click Create new graph style (
 ) on the Styles toolbar.
 - Name the graph style EOIR SNR.
- Select the Enter key to set the graph style's name and to open its Properties ().
Choosing data providers
Use the
- Select the Content page when the Properties Browser opens.
- Expand (
 ) the EOIR Sensor To Target Metrics () data provider in the Data Provider list.
 - Select the Signal to noise ratio (
 ) data provider element in the Data Provider list.
 - Move () the Signal to noise ratio () data provider element to the Y Axis list.
- Enter 600 sec in the Step Size field.
- Click to confirm your changes and to close the Properties Browser.
These are time-dependent metrics for a unique EOIR Sensor-Band / Target pairing.
The SNR is the ratio of the difference in sensor response between target-containing pixel(s) and the local surrounding pixels to the total noise.
EOIR data can take a while to calculate, so it is a good idea to start with coarse settings and dial them in later.
Generating the EOIR SNR graph
With your graph's content configured, generate your graph.
- Select EOIR SNR (
 ) in My Styles () in the Report & Manager.
 - Click .
- View the results.
Be patient. This may take a while.
You saw in the earlier access calculations all the intervals of access. Now you have data representing how well you can image GEO.
Understanding the signal-to-noise data
Gain situational awareness the geometry of the sensor collection during the peak of access interval with the smallest SNR.
- Right-click on the peak of the interval with the smallest SNR.
- Select Set Animation Time in the shortcut menu.
- Bring the 3D Graphics window to the front.
- Rotate your 3D graphics window view so you can see LEO_Sensor targeting GEO.
- Select LEO_Sensor () in the Object Browser.
- Click EOIR Sensor Scene... () on the EOIR toolbar.
- Review the sensor scene when the EOIR Sensor Scene window opens.
- Keep the EOIR Sensor Scene window open.
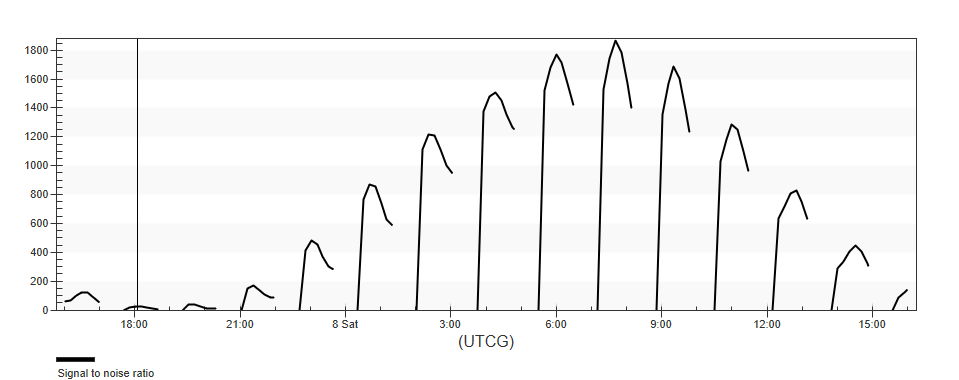
SNR GRAPH: Animation time at Low SNR
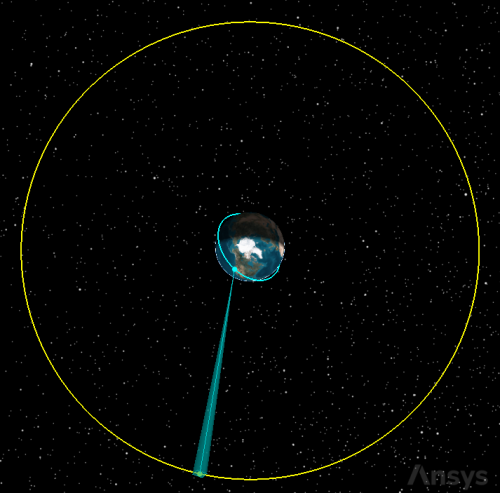
Low Snr: 3D View of leo_sensor targeting geo
The Sun is fully illuminating both GEO and LEO as well as LEO_Sensor.
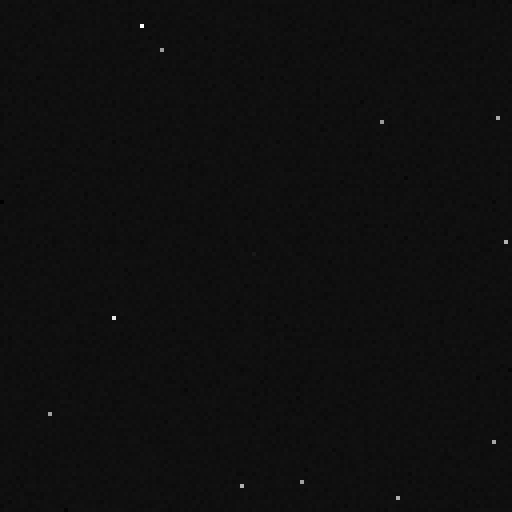
LEO_Sensor Saturated by sunlight
Viewing the interval with the highest SNR
Take a look at the sensor geometry with respect to GEO during the access interval with the highest SNR.
- Bring the EOIR SNR graph back to the front.
- Right-click on the peak of the highest SNR interval.
- Select Set Animation Time in the shortcut menu.
- Bring the 3D Graphics window back to the front.
- Rotate your 3D graphics window view so you can see LEO_Sensor targeting GEO in relation to the Earth.
- Bring the EOIR Sensor Scene window to the front.
- Review the changes.
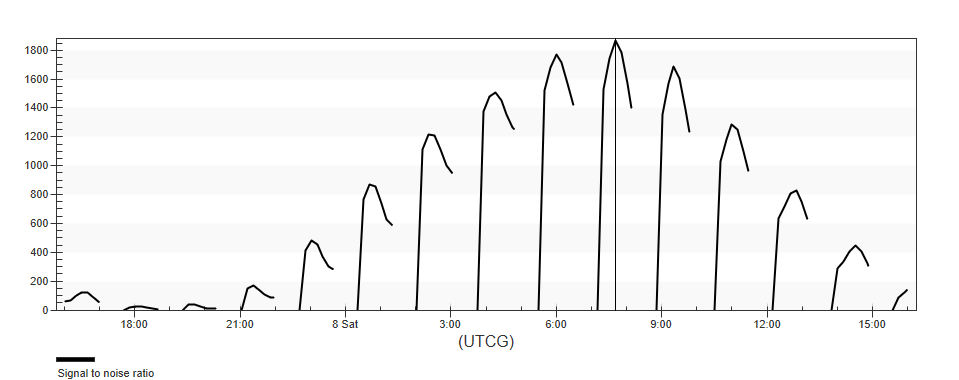
SNR GRAPH: Animation time at High SNR
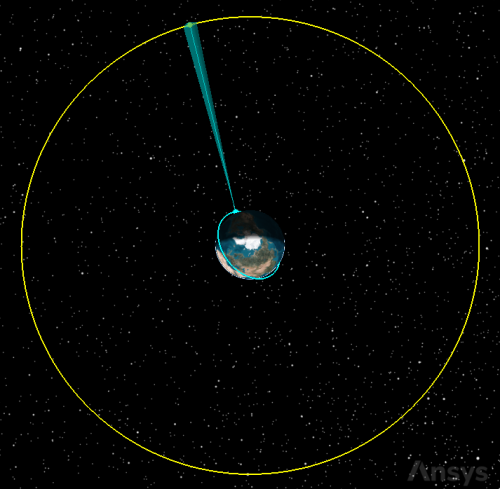
high SNR: 3D View of leo_sensor targeting geo
GEO is in direct sun while LEO and LEO_Sensor remain in Earth's umbra.
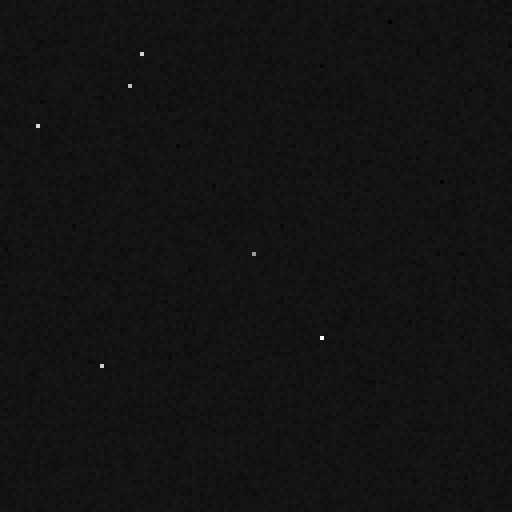
Ideal lighting conditions for viewing GEO
Cleaning up your workspace
Clean up your workspace to prepare for the next section.
- Close () the EOIR Sensor Scene window.
- Close () the EOIR SNR graph.
- Click to close the Report & Graph Manager.
Restricting access using EOIR constraints
The probability of detection (PDET) for a target is generally a function of the SNR, with a larger SNR corresponding to higher detection probability. You can set an

where n is the number of target pixels, LTarget is the average radiance of the target, LBackground is the average radiance of the background, and LTotalNoise is the average noise per pixel, including sensor noise, target shot noise, and background shot noise.
You can view and plot the number of pixels the geometry of the target takes up in pixel space in the sensor scene using the Number of Target Pixels data provider element, which is part of the EOIR Sensor To Target Metrics data provider.
Creating a new constraint
Set a signal-to-noise floor of 50:1 for LEO_Sensor's sensor-to target-metrics by adding it as a new
- Open LEO_Sensor’s () Properties ().
- Select the Constraints - Active page when the Properties Browser opens.
- Click Add new constraints (
 ) in the Active Constraints toolbar.
 - Clear the All Categories check box in the Filter by Category panel.
- Select the EOIR check box.
- Select SNR in the Constraint Name list.
- Click .
- Click to close the Select Constraints to Add dialog box.
- Enter 50 in the Min field in the SNR panel in the Constraint Properties section.
- Click to confirm your changes and close the Properties Browser.
The EOIR capability will automatically recalculate access intervals based on this new constraint. Be patient. This may take a while.
Generating a new Access report
Create a new Access report to compare to the one you made previously.
- Right-click on LEO_Sensor () in the Object Browser.
- Select Access... () in the shortcut menu.
- Click in the Reports panel.
- Close () the Access report when finished.
- Click to close the Access tool.
You can see that there are fewer access intervals (for example, 13) and a shorter Total Duration (for example, approximately 44,400 seconds) when you consider constraints on the sensor's radiometric properties in addition to the geometry of your sensor setup.
Saving your work
Save your work and close out of your scenario.
- Close any other open reports, properties and tools.
- Save () your work.
Summary
You began by propagating two satellites into a LEO and a GEO orbit. You attached an EOIR sensor, LEO_Sensor, to the LEO satellite and targeting the GEO satellite. You confirmed GEO was in LEO_Sensor's field of view by generating an EOIR sensor scene and calculated access between them to determine how often, and for how long, LEO_Sensor could see GEO. You then created and generated a custom SNR graph using an EOIR data provider element. You set your scenario to the time when the SNR was weakest and saw that the sensor was looking at GEO when the Sun was saturating the sensor. You then set your animation time to when the SNR was strongest to find the ideal viewing conditions were when LEO_Sensor was in darkness while GEO was brightly lit by the sun. Finally, you placed an SNR constraint on LEO_Sensor and recalculated access, finding that both the number and total duration of the accesses decreased.