The Solar Panel tool enables you to model the exposure of solar panels mounted on spacecraft, aircraft, and ground vehicles over a given time interval. You can use the result of the analysis to determine the availability of electrical power for operations that the vehicle and onboard apparatus will perform.
To access the Solar Panel tool for a particular object, highlight the object in the Object Browser and select Solar Panel... from the <object> menu.
The Solar Panel tool displays the following two windows:
- Solar Panel View window. This window enables you to see the changes in the position of solar panels during animation. Use the Animation toolbar to set your scenario in motion. Use the
 button on the Default toolbar to bring the Solar Panel window to the foreground.
 - Solar Panel window. This window enables you to do the following:
- Identify obscuring objects
- Enter visualization data
- Define the time period during which data is reported
- Display data related to vehicle solar panels
The Color Quality setting for your system display must be set to at least 24-bit color for the Solar Panel Tool to work.
You cannot use the Solar Panel tool on any *.mdl file that contains the FaceEmissionColor parameter or that has a texture on the solar panel. You can use these options on a *glb or *.gltf model file.
By default, the solar panel attempts to use the GPU to accelerate the solar panel calculations. If you encounter an error, go to Edit > Preferences... > General and clear the GPU Accelerated Analysis check box.
Obscuring objects
The tool automatically populates the Obscuring Objects list with scenario objects, excluding stars and planets, that are candidates for obstructing sunlight directed at the subject vehicle's solar panels.
The Earth (or central body) is always taken into account in the analysis, even though it does not appear on the list. An example is when the vehicle passes into the Earth's umbra or penumbra. In addition, STK automatically calculates instances in which the subject's own body obstructs sunlight from reaching its solar panels.
For objects in the list, you can use the mouse to select individual items or use the following buttons:
- Click to select all items in the Obscuring Objects list.
- Click to clear all items in the Obscuring Objects list.
Visualization
Use this subpanel to set the following visualization properties:
| Property | Description |
|---|---|
| Bound Radius | You can tailor the view to yield the optimal display for visualization and analysis. The field of view for solar panel illumination analysis is defined in terms of a rectangular plane rather than a linear boresight or direction of gaze. You can limit the size of that plane by specifying the radius of a circle centered in the rectangle and touching its long sides; that is, a circle having a radius equal to one-half the length of one of the short sides of the rectangle. This ensures that, once the optimal dimension is set, the vehicle remains within view even when rotated. |
| Solar Panel Groups |
Select one or more solar panel groups for the tool to highlight in the Solar Panel View window and take into consideration in the solar panel illumination analysis. The projection is orthographic; that is, without perspective, with the sun's rays treated as parallel rather than radial. The impact on the solar illumination analysis is insignificant, given the dimensions involved here. |
Solar Panel View window
The Solar Panel View window displays the vehicle in black outline against a white background, with the solar panels shown in gray if illuminated.
The greater the effective area of solar illumination of a panel, the brighter the shade of gray in which it is displayed. The effective area is the area of the projection of the solar panel onto a plane perpendicular to the direction of the solar rays striking the panel.
To compute the electrical power captured by the solar panels at a given point in time, the Solar Panel tool applies the following basic power equation:
Power = Efficiency X Solar Intensity X Effective Area X Solar Irradiance
where:
- Efficiency is specified for the solar panel in the vehicle model file and ranges between 0 and 100 (%).
- Solar Intensity ranges from umbra (0.0) through penumbra (0.0 < i < 1.0) to full sunlight (1.0).
- Effective Area is the cross-sectional area defined above.
- Solar Irradiance is expressed in Watts per square meter. The Solar Panel tool computes this value by dividing the Sun luminosity (3.828e+26 W) by the area of a sphere centered at the Sun with a radius from the center of the Sun to the center of mass of the object. For an object exactly at one astronomical unit from the Sun, this value is 1361.128 W/m2.
Data
The Solar Panel tool computes solar illumination over time by animating the scenario and periodically counting the pixels corresponding to illuminated portions of the solar panels under consideration. You can specify the following parameters for the computations:
| Parameterq | Description |
|---|---|
| (time interval selection) |
Click the down arrow to display and elect from the following options for specifying the time interval for your analysis computations:
|
| Time Step | This is the time step that the tool uses to establish data points for the interval. |
After establishing the time interval and time step, you can then perform the following computation options:
- Click to calculate solar obscuration over the specified start and stop times. If you have already computed illumination data for this vehicle, STK displays a window that enables you to choose to delete existing data or cancel the compute.
- Click to remove existing solar panel illumination data so that computer memory is restored once analysis is complete.
Changing the interval(s) does not force recomputation of the data.
Data reporting
Once you compute solar panel data, you can display data in report or graph form using the following options:
| Option | Description |
|---|---|
| Report | Select this to display your data in report form. |
| Graph | Select this to display your data in graph form. |
| Type |
Select the type of data to display for each time step from the following options:
|
To create the report or graph style and compute the solar obscuration, click .
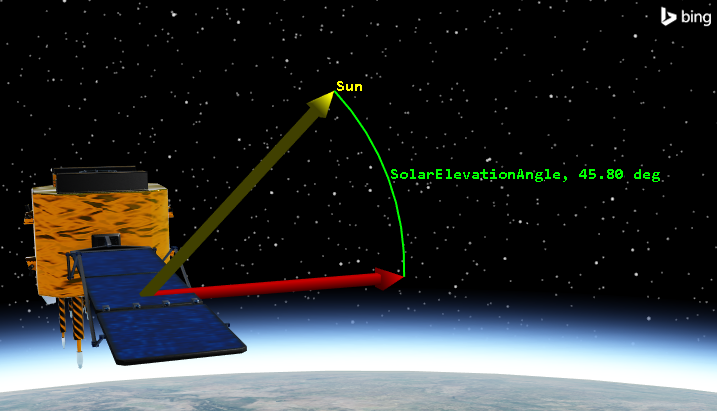
Elevation angle from the solar panel surface to the sun