STK Premium (Air), STK Premium (Space), or STK Enterprise
You can obtain the necessary licenses for this tutorial by contacting AGI Support at support@agi.com or 1-800-924-7244.
This lesson requires version 12.7 of the STK software or newer to complete in its entirety.
Required product install: A 64-bit version of Java is required to run Analyzer. See the Analyzer system requirements for more information.
The results of the tutorial may vary depending on the user settings and data enabled (online operations, terrain server, dynamic Earth data, etc.). It is acceptable to have different results.
Capabilities covered
This lesson covers the following capabilities of the Ansys Systems Tool Kit® (STK®) digital mission engineering software:
- STK Pro
- Coverage
- STK Analyzer
Problem statement
Across the industry, the digital mission engineering (DME) process is becoming more complex. Engineers and operators require a quick way to determine how various mission components can be changed and the impact of doing so on the overall effectiveness of the mission. You want to design and test a new satellite constellation to provide persistent two-satellite coverage over a ground site. You have a defined orbital regime in which you must remain, but you can vary the number of satellites you launch.
Solution
Use the Analyzer and Coverage capabilities to model various aspects of your mission with one integrated tool. You will create a fully connected digital thread with a common mission environment at the core. Your goal in this exercise is to understand how you can provide persistent coverage with two satellites at any given time. The components you can vary are the number of satellites and the number of orbital planes. You will build the various components to fit your mission requirements step by step and then analyze how changing those parameters affects the number of satellites that have access to the ground site.
What you will learn
Upon completion of this tutorial, you will understand:
- How to use a Satellite Collection object with the Analyzer capability
- How to use the Coverage Tool
- Define and run a Design of Experiments Trade Study with the Analyzer capability
- Sync the selected results from Analyzer to your scenario
Creating a new scenario
First, you must create a new scenario, and then build from there.
- Launch the STK application (
 ).
). - Click
 Create a Scenario in the Welcome to STK dialog box.
 - Enter the following in the STK: New Scenario Wizard:
- Click when you finish.
- Click Save (
 ) when the scenario loads. The STK application creates a folder with the same name as your scenario for you.
 - Verify the scenario name and location in the Save As dialog box.
- Click .
| Option | Value |
|---|---|
| Name | Analyzer_DOE |
| Location | Default |
| Start | Default |
| Stop | Default |
Save (![]() ) often during this scenario!
) often during this scenario!
Using a Satellite Collection object
A Satellite Collection (![]() ) object models a group of satellites as a single object in the Object Browser. The associated satellites do not appear in the Object Browser, but are available for analysis purposes within other computational tools such as the STK application's Coverage capability, the Deck Access and Advanced CAT tools, and CommSystem objects.
) object models a group of satellites as a single object in the Object Browser. The associated satellites do not appear in the Object Browser, but are available for analysis purposes within other computational tools such as the STK application's Coverage capability, the Deck Access and Advanced CAT tools, and CommSystem objects.
Inserting a Satellite Collection object
Use the Insert STK Objects Tool to insert a Satellite Collection (![]() ) object into your scenario.
) object into your scenario.
- Select SatelliteCollection (
 ) in the Select An Object To Be Inserted list of the Insert STK Objects tool.
 - Select Insert Default () in the Select A Method list.
- Click .
- Right-click on SatelliteCollection1 () in the Object Browser.
- Select Rename in the shortcut menu.
- Rename SatelliteCollection1 () Walker_Collection.
Understanding the Walker-type selection
The Walker-type selection provides a constellation of satellites distributed in a series of altitude shells. Each shell contains evenly spaced orbital planes and Walker populates each orbital plane with evenly spaced satellites. All the satellites in a shell have the same period and inclination. Walker evenly spaces the ascending nodes of the orbital planes over a range (angle spread) of right ascensions (RAAN). You can generate multiple shells within a single Satellite Collection object.
Updating the Walker-type subset
Update Walker_Collection's (![]() ) properties to fit your orbital regime.
) properties to fit your orbital regime.
- Open Walker_Collection's () Properties (
 ).
). - Select the Basic - Definition page when the Properties Browser opens.
- Select Shells - Name - 1 in the Walker Properties panel.
- Click Edit selected shell (
 ) in the Shells toolbar.
 - Enter Walker Group in the Shell Name field of the Edit Shell dialog box.
- Set the following options in the order shown in Shell Properties panel:
- Set the following options in the Plane 1 : Slot 1 panel:
- Click .
- Click to accept your changes and to close the Properties Browser.
You can see that Walker is the default selection for Type.
| Option | Value |
|---|---|
| Inter Plane Phase Increment | 0 |
| Planes | 1 |
| Satellites in Planes (Slots) | 1 |
| Option | Value |
|---|---|
| Semi-Major Axis (a) | 7158 km |
| Inclination (i) | 45 deg |
Inserting a ground site
Insert a Place object using the From City Database method.
- Insert a Place (
 ) object using the From City Database (
 ) method.
 - Enter Boulder in the Name field of the Search Standard Object Data dialog box.
- Click .
- Select Boulder - Colorado in the Results list.
- Click .
- Click to close the Search Standard Object Data dialog box.
Defining single-object coverage
To evaluate the quality of coverage to a single object in the STK application, you can use the Coverage Tool. This tool is available for facilities, places, targets, radars, receivers, sensors, targets, transmitters, and vehicles. Use the
Your mission is to create a constellation with persistent coverage over a single ground site. Set up the analysis using the Coverage Tool.
- Right-click on Boulder () in the Object Browser.
- Select Coverage... (
 ) in the shortcut menu.
 - Select AllSatellites (
 ) in the Assets list of the Coverage Tool.
 - Click .
Defining the quality of coverage
The parameter you care about is the minimum number of satellites. N Asset Coverage measures the number of assets available simultaneously during coverage, where N is between zero and the total number of assets defined in the coverage definition.
- Click in the Figure of Merit panel.
- Open the Type drop-down list in the Definition panel of the Specify Figure of Merit dialog box.
- Select N Asset Coverage.
- Open the Compute drop-down list.
- Select Minimum.
- Click to close the Specify Figure of Merit dialog box.
- Click to close the Coverage Tool.
Using the Analyzer capability
The Analyzer capability provides a set of analysis tools that:
- Enable you to understand the design space of your systems
- Enable you to perform analyses in the STK application easily without involving programming or scripting
- Introduce trade study and post-processing capabilities
- Can be used with all STK scenarios, including those with satellites propagated using the Ansys STK/Astrogator® capability
Opening Analyzer
Open Analyzer and pull in the parameters for the trade study.
- Select the Analysis menu item.
- Select Analyzer in the shortcut menu.
- Select Analyzer... (
 ) in the Analyzer second shortcut menu.
Analyzer may open behind the STK application window. Arrange your workspace so you are able to see Analyzer.
Defining the input variables
You need to select input and output variables from the main Analyzer window. Start by adding the input variables.
- Select Walker_Collection () in the STK Variables list.
- Select the General tab located in the STK Property Variables panel.
- Select Walker ().
- Move (
 ) Walker () to the Analyzer Variables list.
Defining the output variables
Now that the input variables are defined, you can add the output variables.
- Select Boulder () in the STK Variables list.
- Select the Object Coverage () tab in the Data Provider Variables panel.
- Expand (
 ) the FOM Static Value folder (
 ).
). - Select the FOM Static Value (
 ) data provider element.
 - Move () FOM Static Value () to the Analyzer Variables list.
Using the Design of Experiments tool
You can use the Design of Experiments (DOE) Tool to create and perform tables of runs for a scenario. You can either use a classical design type, such as a Full Factorial design, or supply your own custom table of runs.
Adding the design variables
You want to find out how many satellites and planes you need to provide persistent coverage over the ground site.
- Click Design of Experiments... (
 ) in the Analyzer toolbar.
 - Click and drag Planes (
 ) from the Component Tree to the Design Variables list.
 - Open the drop-down list (
 ) in the Values field.
 - Select Low: High: Levels: in the shortcut menu.
- Drag SatellitesInPlanes () from the Component Tree to the Design Variables list.
- Open the drop-down list () in the Values fields.
- Select Low: High: Levels: in the shortcut menu.
Adding bounds to the design variables
For each design variable, you must set the values for the upper and lower bounds as well as the number of levels.
- Click on the blank line after each property and enter the following values:
- In the Design panel, ensure Parameter Scan is set and there are a total of 140 runs scheduled.
| Name | Low | High | Levels |
|---|---|---|---|
| Model.STK.Analyzer_Coverage.Walker_Collection.Shell_Walker_Group.Planes | 2 | 11 | 10 |
| Model.STK.Analyzer_Coverage.Walker_Collection.Shell_Walker_Group.SatellitesInPlanes | 2 | 15 | 14 |
This gives you a large variety of satellite and plane combinations to run through.
Selecting the response variable
The critical response variables are the factors of the model about which you are trying to gain an understanding. To perform your DOE, you must specify a response variable.
- Drag FOM_Static_Value (
 ) from the Component Tree to the Response Variables list.
 - Click to execute your DOE test and to open the Data Explorer.
When the DOE test is executed, a value for each response value is found for each sample point or run.
Viewing the results
You can use Add View in the
For this exercise, plot the results as a 3D Scatter Plot. A 3D Scatter Plot displays an X-Y plot of variables in the model. The Data Explorer stores values for all variables in a model and special variables from the trade study, such as the objective function for the Optimization Tool. Any variable in the model can be plotted against any other variable.
- Click in the Status panel after all 140 runs are complete.
- Click in the Data Explorer toolbar.
- Select 3D Scatter Plot in the shortcut menu.
- Adjust the view. You will see the two Design Variables with the Response in a visual interactive graph.
If you are using an older version of STK Analyzer that doesn't have a Show Data Explorer button, bring the Data Explorer to the front after all 140 runs are complete.
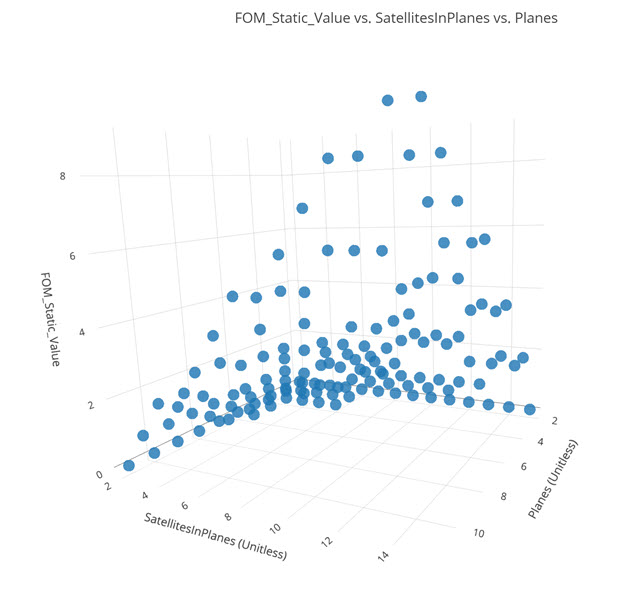
3D scatter plot
Constraining the figure of merit value
The Figure of Merit value you are interested in is the minimum number of satellites that have access to the ground site. For this mission, assume at least two satellites need to have concurrent access at all times for the mission to be considered successful. Add constraints to specify upper and lower limits on your figure of merit value.
- Click
 in the plot options menu to open the Constraints dialog box.
 - Click Uncheck All (
 ) to clear all the values from FOM_Static_Value.
 - Select the check box for 2 in FOM_Static_Value.
- Click outside the Constraints panel to confirm your changes and to return to the 3D Scatter Plot.
- Examine the graph.
- Hover over a design point to display information about that point.
- Close the 3D Scatter Plot.
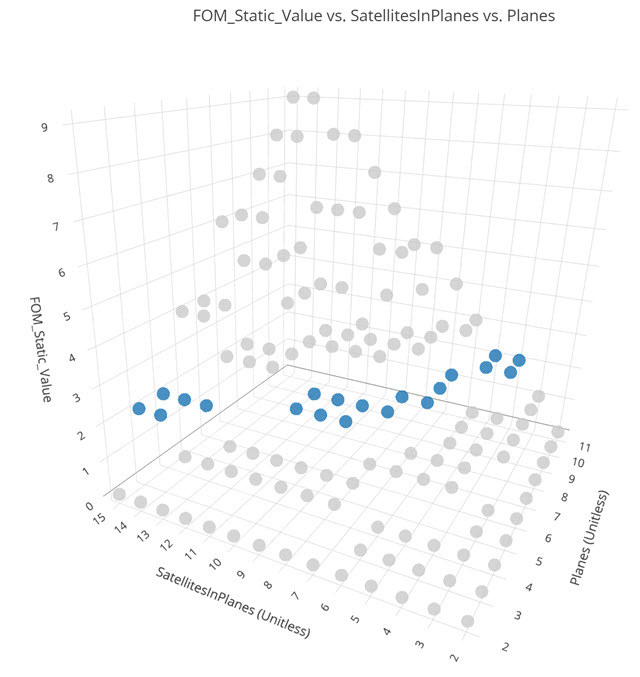
Updated 3D scatter plot
Your 3D Scatter Plot might be slightly different from the image. The plot displays the feasible values in blue. The infeasible results you are not interested in are grayed out. You can determine which combination gives you the fewest number of accesses that provide continuous coverage utilizing the fewest number of satellites.
Using the Data Explorer
You can use the Data Explorer to search for your values.
- Bring the Data Explorer to the front.
- Right-click on response [Model.STK.Analyzer_Design of Experiement.Boulder.ObjectCoverage.FOM Static Value.FOM Static Value] in the Legend list.
- Select Sort Runs in the shortcut menu.
- Select Ascending in the Sort Runs submenu.
- Scroll until you find a combination where you have a FOM value of 2 and the fewest number of satellites (SatellitesInPlanes × Planes).
- Note both values (SatellitesInPlanes and Planes) that work for you.
- Close the Data Explorer.
- Click in the Save dialog box.
It's possible that you can find multiple combinations that work. For example, you could have 10 orbital planes with 4 satellites in each plane, or 8 orbital planes with 5 satellites per plane. Choose the combination that best fits your requirements.
Syncing the results to the STK application
Use the values that work for you.
- Return to the DOE Tool.
- Click on the Planes () Value field in the Component Tree.
- Enter the value you determined from the trade study (for example, 10).
- Click on the SatellitesInPlanes () Value field in the Component Tree.
- Enter the value you determined from the trade study (for example, 4).
- Click below the Component Tree.
- Close the DOE Tool and Analyzer.
- Bring the 3D Graphics window to the front.
- Click Home View (
 ) in the 3D Graphics window toolbar.
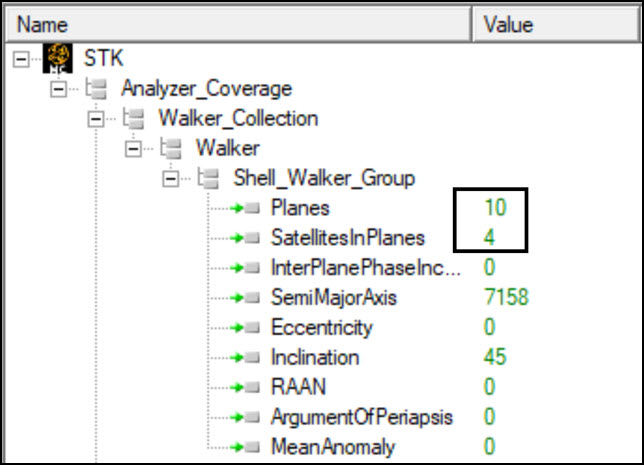
updated component Tree values
This automatically updates both the Satellite Collection object and the Coverage Tool settings.
You should see multiple satellites in orbit around the Earth based on the values you synced from the DOE Tool to STK.
Determining the orbital parameters for the satellites
An obvious question is how you determine where to place the satellites after launch using the DOE analysis. Generate an All Satellites Walker report for further study and analysis.
- Right-click Walker_Collection () in the Object Browser.
- Select Report & Graph Manager... (
 )in the shortcut menu.
 - Select the All Satellites Walker (
 ) report in the Installed Styles () list in the Styles panel of the Report & Graph Manager.
 - Click .
- View the data in the report.
- Close the report and the Report & Graph Manager when finished.
Saving your work
Clean up your workspace and close out your scenario.
- Close any reports and tools you still have open.
- Save () your work.
Summary
The trade study calculated the minimum number of satellites need to provide persistent coverage of the ground site. Using our own requirements of a minimum of two satellites, you selected the number of satellites and planes to meet this requirement based on the Analyzer DOE Tool analysis.