Task List/Gantt Chart
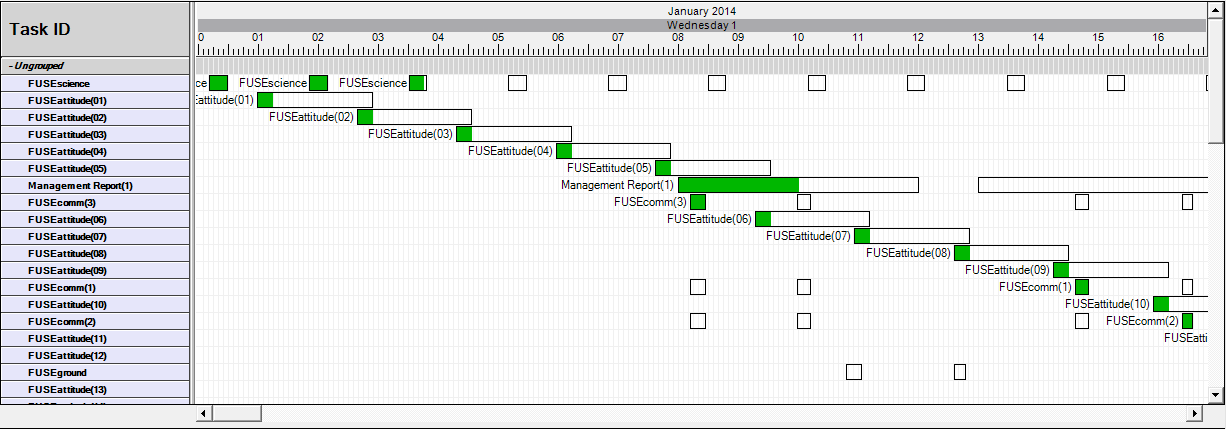
The Task List/Gantt Chart is a graphical display of tasks, timeslots, and task assignments.
The Task List/Gantt Chart may be viewed by clicking the  button on the Astro Scheduler Engine Tool Bar.
Task List/Gantt Chart
If this view appears blank, Astro Scheduler Engine may be in a graphics-off mode. See Graphic Updates Feature for more information.
The left-hand portion of the Task List/Gantt Chart provides a list of all tasks within a schedule. At times, tasks may appear arranged in groups. Whenever this is the case, group headings will appear in a dark color. Tasks that belong within that group appear in a light color. A group's tasks may be rolled up to hide the tasks by clicking the '-' next to the group name. Likewise, rolled up groups can be expanded to show all tasks by clicking the '+' next to the group name.
The right-hand portion provides a graphical display of various windows of time. A window of time is displayed in the form of a rectangle or bar with the left side of the bar corresponding to the window start time and the right side of the corresponding to the window end time. Each bar is colored to signify the kind of window it represents. The description of the various colors used in the Gantt chart may be found on the Legend.
If a task or resource appears red in color, this indicates that a violation has occurred. Right-click on the object and select Report from the pop-up menu. The resulting resource report or task report will indicate the nature of the violation. See Schedule Validation for more information.
Gantt Chart Time Scale
Times are read on the horizontal timescale at the top of the chart. Initially, the Gantt chart time axis is set to the scenario start and stop times as set on the General Tab of the Schedule Properties form. The displayed scale and times can be changed either by right-clicking on the timescale axis, clicking on the ![]() button on the tool bar, or by selecting View -> Zoom/Timescale Properties... from the Astro Scheduler Engine menu bar. Each of these actions will open the Timescale View Properties Form. Whenever the Gantt chart time axis is larger than the form can display, a horizontal scrolll bar will appear at the bottom of the Gantt chart. This scroll bar can be used to pan forward and backward through the Gantt chart.
button on the tool bar, or by selecting View -> Zoom/Timescale Properties... from the Astro Scheduler Engine menu bar. Each of these actions will open the Timescale View Properties Form. Whenever the Gantt chart time axis is larger than the form can display, a horizontal scrolll bar will appear at the bottom of the Gantt chart. This scroll bar can be used to pan forward and backward through the Gantt chart.
Modifying the Gantt View
There exists several options that enable you to modify the manner in which tasks are displayed in the Gantt chart. The controls for these options may be found on the Gantt View Properties Form. To open this form, select View -> Gantt View Properties... from the Astro Scheduler Engine Menu Bar.
Refreshing the Gantt View
At anytime the Gantt chart may be refreshed using the  button on the Astro Scheduler Engine Tool Bar.
Drag and Drop Task Assignments
When a task is clicked, you may manually make changes to that task via the Gantt. A locked task assignment is indicated by a solid blue rectangle on the Gantt. There are a couple different ways a task may be manually edited via the Gantt. You may drag the start or end of an assignment changing the assigned duration or you can drag and drop the entire assignment and move the assignment to a new timeslot.
Right-Click Menu
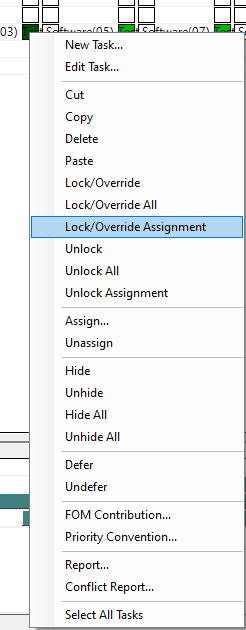
In addition to the actions available in the Task Menu, right-clicking an assignment brings up a context menu with additional "Lock/Override Assignment" and "Unlock Assignment" options. These options lock and unlock, respectively, the assignment that was right-clicked if its task is a handover task. Otherwise, the assignment will not be affected.
![]()