Series: Error Bars
Return to Plot Options Menu | Series tab
Subtab menu: Mode | Range/Bins | Style | Error Bars | Color Bar | Color Bar Ticks
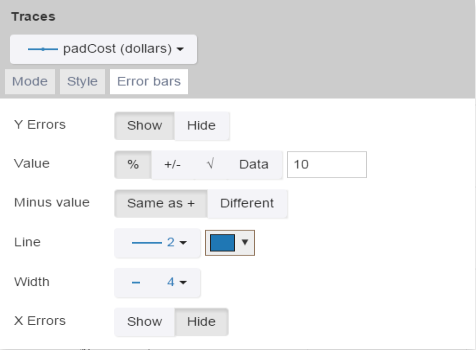
Use the Error Bars tab to set the display of error bars in the plot.
Some controls only appear for certain plots or with certain options selected.
| Control Name | Use/Options |
|---|---|
| Z Errors | Determines if the Z error bars are shown.
|
| Value | Determines the rule used to generate error bars.
|
| Minus Value | Determines if the error bars are symmetrical.
|
| Line | Sets the options for the error bar.
|
| Width | Sets the width for the endcap of the error bars.
|
| Y Errors | Determines if the Y error bars are shown.
|
| Style | Determines the style for the Y error bars.
|
| X Errors | Determines if the X error bars are shown.
|
| Style | Determines the style for the X error bars.
The options will change depending on if this is a 2D or a 3D plot.
|

See Also Data Explorer