Capacity Chart
The capacity chart shows the time dependent capacity value of all capacity-applicable resources over the scheduling period.
The capacity chart will not show accurate information until the Schedule De-conflictor is run.
The capacity chart may be viewed in two ways:
- By selecting Resource -> Charts -> Capacity from the Menu Bar.
- By clicking the Capacity Button on the Status Tab of the Resource Definition Form.
Capacity Chart
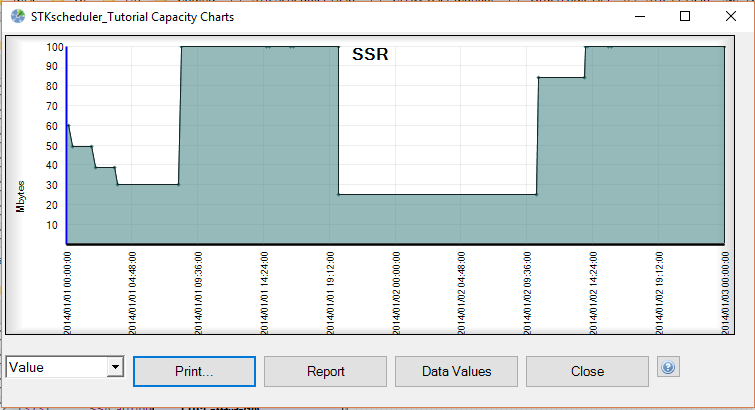
On the capacity chart, capacity is displayed as a percentage of the difference between the maximum and minimum capacity limit as defined on the Capacity Tab of the Resource Definition Form for each individual resource. In this way, a capacity of 0% indicates the instantaneous capacity value is equal to the minimum capacity limit. Likewise, a capacity of 100% indicates the instantaneous capacity value is equal to the maximum capacity limit.
Print... Button
The print button opens the Page Preview Form to allow you to define how the chart will look once printed.
Report Button
The report button creates a resource report and opens the Resource Report Form.
Data Values
The data values button creates a data values report and opens the Data Values Reports Form.
Close Button
The close button closes the chart form.
![]()