Visualizing Platforms |
While Insight3D® provides the ability to visualize almost anything, most users will want to create applications that visualize the definitional objects and analysis results used with other DME Component Libraries. The Platform Graphics library provides an abstraction on top of Insight3D to make this process easier. While Platform Graphics does not replace the need to learn at least the basics of Insight3D, it simplifies the process of creating robust visualization when working with Platforms, ObjectExtensions, and other definitional objects. This topic assumes basic familiarity with Insight3D and DME Component Libraries.
Platform Graphics is built upon the same patterns used throughout DME Component Libraries, specifically, evaluatorsService Providers. It provides ObjectExtensions that describe graphical properties over time. These extensions are then added to individual Platforms and other ExtensibleObjects, which are then added to a ServiceProviderDisplay, which then handles representing the objects in Insight3D, and maintaining the underlying primitives necessary for visualization.
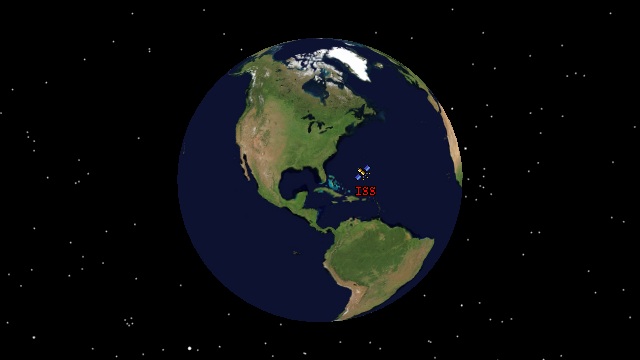
The following code sample is a simple example that draws a satellite marker and label at the location of the International Space Station.
EarthCentralBody earth = CentralBodiesFacet.getFromContext().getEarth();
TwoLineElementSet issTle =
        new TwoLineElementSet("1 25544U 98067A   10172.34241898  .00007451  00000-0  60420-4 0  3627\r\n" +
                              "2 25544  51.6459 209.3399 0009135 352.3227 186.5240 15.71934500664129");

Platform iss = new Platform("ISS");
iss.setLocationPoint(new Sgp4Propagator(issTle).createPoint());
iss.setOrientationAxes(Axes.getRoot());

TextGraphicsExtension issText = new TextGraphicsExtension();
issText.getTextGraphics().setFont(new ConstantGraphicsParameter<>(new Font("Times New Roman", Font.PLAIN, 10)));
issText.getTextGraphics().setText(new ConstantGraphicsParameter<>(iss.getName()));
issText.getTextGraphics().setColor(new ConstantGraphicsParameter<>(Color.RED));
iss.getExtensions().add(issText);

MarkerGraphicsExtension issMarker = new MarkerGraphicsExtension();
issMarker.getMarkerGraphics().setTexture(new ConstantGraphicsParameter<>(satelliteTexture));
iss.getExtensions().add(issMarker);

final ServiceProviderDisplay display = new ServiceProviderDisplay();
display.getServiceProviders().add(iss);
display.applyChanges();

EventHandler<TimeChangedEventArgs> timeChanged = EventHandler.of((sender, e) -> {
    display.update(e.getTime());
});
SceneManager.addTimeChanged(timeChanged);

SceneManager.getAnimation().playForward();
First, we create a Platform representing the ISS, using a TLE to determine its position. We then create a TextGraphicsExtension and a MarkerGraphicsExtension and assign their properties to configure how the text and marker should be drawn. Next, we create a ServiceProviderDisplay and add the Platform to the display. Since this is the only Platform we are adding, we immediately call applyChanges. Finally, we add an event handler to the TimeChanged (add / remove) event which will call update which will update the visualization when the animation time changes, ensuring that the marker and label are always located at the current ISS location.
ServiceProviderDisplay handles the necessary work behind the scenes to update the Insight3D primitives to show the correct visualization. Next, we will dig deeper into the individual objects being used in this example.
In the above example, instead of simply assigning values to the various graphical properties, we are using instances of ConstantGraphicsParameter<T>. For example, instead of assigning the color yellow directly to the Color (get / set) property, we created an instance of ConstantGraphicsParameter<Color>. The reason for this difference is that we are not just defining the color to be yellow, rather, we are defining what the color of the object will be over time. In this case, using ConstantGraphicsParameter<Color> means that the color itself will remain constant as time changes.
The Color (get / set) property is actually defined as a GraphicsParameter<Color>, which is an abstract base class that is a definitional object which provides an evaluator for the property over time. In addition to ConstantGraphicsParameter<T>, there are two other types of parameters provided: TimeIntervalGraphicsParameter<T>, which defines the value using the data inside of a TimeIntervalCollection<T>, and AccessQueryGraphicsParameter<T>, which defines the value depending on the results of an AccessQuery.
For example, suppose we wanted the text of the ISS to be green before January 1st, 2009, and red anytime after that. The following code sample shows how to accomplish this:
TimeIntervalCollection1<Color> intervals = new TimeIntervalCollection1<>();
Color green = new Color(0x008000);
intervals.add(new TimeInterval1<>(JulianDate.getMinValue(), new GregorianDate(2009, 1, 1).toJulianDate(), green, true, false));
intervals.add(new TimeInterval1<>(new GregorianDate(2009, 1, 1).toJulianDate(), JulianDate.getMaxValue(), Color.RED, false, true));
issText.getTextGraphics().setColor(new TimeIntervalGraphicsParameter<>(intervals));
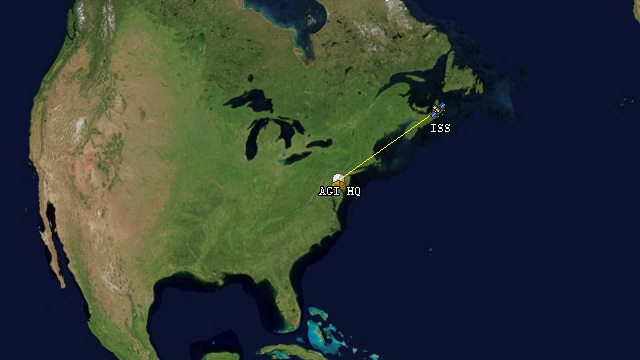
So far, the examples have used color, but properties of other types work the same way. Suppose we wanted to know when the ISS had line of sight to a point on the ground, for example, AGI headquarters. In DME Component Libraries, we model this using LinkInstantaneous and a CentralBodyObstructionConstraint, as seen in the code sample below:
PointCartographic facilityPoint = new PointCartographic(earth, new Cartographic(-1.3191780323141054, 0.69871349190638687, 0.0));
Platform facility = new Platform("AGI HQ");
facility.setLocationPoint(facilityPoint);
facility.setOrientationAxes(new AxesEastNorthUp(earth, facilityPoint));

LinkInstantaneous link = new LinkInstantaneous(iss, facility);
CentralBodyObstructionConstraint constraint = new CentralBodyObstructionConstraint(link, earth);
Given the link and an access constraint that tells us when the link is valid, we can visualize the valid link by drawing a line connecting our two platforms in the following code sample:
LinkGraphicsExtension linkGraphics = new LinkGraphicsExtension();
linkGraphics.getLinkGraphics().setColor(new ConstantGraphicsParameter<>(Color.YELLOW));

AccessQueryGraphicsParameter<Boolean> accessParameter = new AccessQueryGraphicsParameter<>();
accessParameter.setQuery(constraint);
accessParameter.setAccessExists(true);
accessParameter.setAccessUnknown(false);
accessParameter.setNoAccess(false);

linkGraphics.getLinkGraphics().getDisplayParameters().setDisplay(accessParameter);
link.getExtensions().add(linkGraphics);
First, we create a LinkGraphicsExtension which describes the graphical properties of the link, and assign the color of the link to be yellow. We only want the link to be shown when the constraint is satisfied. Since CentralBodyObstructionConstraint is an AccessQuery, we can use an AccessQueryGraphicsParameter<T> to specify the values to associate with access results. In this case, we configure the Display (get / set) property to be true when access exists, and false otherwise.
The following code sample presents a complete example of the above visualization:
EarthCentralBody earth = CentralBodiesFacet.getFromContext().getEarth();
Texture2D satelliteTexture = SceneManager.getTextures().fromUri(satelliteTexturePath);
Texture2D facilityTexture = SceneManager.getTextures().fromUri(facilityTexturePath);

TwoLineElementSet issTle =
        new TwoLineElementSet("1 25544U 98067A   10172.34241898  .00007451  00000-0  60420-4 0  3627\r\n" +
                              "2 25544  51.6459 209.3399 0009135 352.3227 186.5240 15.71934500664129");

Platform iss = new Platform("ISS");
iss.setLocationPoint(new Sgp4Propagator(issTle).createPoint());
iss.setOrientationAxes(Axes.getRoot());

MarkerGraphicsExtension issMarker = new MarkerGraphicsExtension();
issMarker.getMarkerGraphics().setTexture(new ConstantGraphicsParameter<>(satelliteTexture));
iss.getExtensions().add(issMarker);

TextGraphicsExtension issText = new TextGraphicsExtension();
issText.getTextGraphics().setFont(new ConstantGraphicsParameter<>(new Font("Courier New", Font.PLAIN, 8)));
issText.getTextGraphics().setOutline(new ConstantGraphicsParameter<>(true));
issText.getTextGraphics().setOutlineColor(new ConstantGraphicsParameter<>(Color.BLACK));
issText.getTextGraphics().setText(new ConstantGraphicsParameter<>(iss.getName()));
issText.getTextGraphics().setOrigin(new ConstantGraphicsParameter<>(Origin.TOP_CENTER));
issText.getTextGraphics().setPixelOffset(new ConstantGraphicsParameter<>(new PointF(0.0f, satelliteTexture.getTemplate().getHeight() / -2.0f)));
issText.getTextGraphics().setColor(new ConstantGraphicsParameter<>(Color.WHITE));
iss.getExtensions().add(issText);

PointCartographic facilityPoint = new PointCartographic(earth, new Cartographic(-1.3191780323141054, 0.69871349190638687, 0.0));
Platform facility = new Platform("AGI HQ");
facility.setLocationPoint(facilityPoint);
facility.setOrientationAxes(new AxesEastNorthUp(earth, facilityPoint));

MarkerGraphicsExtension facilityMarker = new MarkerGraphicsExtension();
facilityMarker.getMarkerGraphics().setTexture(new ConstantGraphicsParameter<>(facilityTexture));
facility.getExtensions().add(facilityMarker);

TextGraphicsExtension facilityText = new TextGraphicsExtension();
facilityText.getTextGraphics().setFont(new ConstantGraphicsParameter<>(new Font("Courier New", Font.PLAIN, 8)));
facilityText.getTextGraphics().setOutline(new ConstantGraphicsParameter<>(true));
facilityText.getTextGraphics().setOutlineColor(new ConstantGraphicsParameter<>(Color.BLACK));
facilityText.getTextGraphics().setText(new ConstantGraphicsParameter<>(facility.getName()));
facilityText.getTextGraphics().setOrigin(new ConstantGraphicsParameter<>(Origin.TOP_CENTER));
facilityText.getTextGraphics().setPixelOffset(new ConstantGraphicsParameter<>(new PointF(0.0f, facilityTexture.getTemplate().getHeight() / -2.0f)));
facilityText.getTextGraphics().setColor(new ConstantGraphicsParameter<>(Color.WHITE));
facility.getExtensions().add(facilityText);

LinkInstantaneous link = new LinkInstantaneous(iss, facility);
CentralBodyObstructionConstraint constraint = new CentralBodyObstructionConstraint(link, earth);

LinkGraphicsExtension linkGraphics = new LinkGraphicsExtension();
linkGraphics.getLinkGraphics().setColor(new ConstantGraphicsParameter<>(Color.YELLOW));
linkGraphics.getLinkGraphics().getDisplayParameters().setDisplay(new AccessQueryGraphicsParameter<>(constraint, true, false, false));
link.getExtensions().add(linkGraphics);

final ServiceProviderDisplay display = new ServiceProviderDisplay();
display.getServiceProviders().add(iss);
display.getServiceProviders().add(link);
display.getServiceProviders().add(facility);
display.applyChanges();

EventHandler<TimeChangedEventArgs> timeChanged = EventHandler.of((sender, e) -> {
    display.update(e.getTime());
});
SceneManager.addTimeChanged(timeChanged);

SceneManager.getAnimation().playForward();
GraphicsParameter<T> provide a mechanism to define the visual state of a scene declaratively, as it changes over time, which is useful to connect analysis results with a visualization.
In the previous section, we described ServiceProviderDisplay as the object responsible for managing the Insight3D primitives that make up the visualization. However, ServiceProviderDisplay actually just delegates the work to a set of ServiceProviderVisualizers, each of which handle visualization of a specific type of IServiceProvider. The full set of visualizers together create a complete picture. For example, a MarkerVisualizer uses the IMarkerGraphicsService and ILocationPointService to draw a marker at the current location of the service provider.
ServiceProviderVisualizers can be used to provide custom visualization for services you define yourself, however, this is advanced functionality. In practice, the standard set of visualizers, which are provided by the Visualizers (get) property, are available by default and serve most visualization needs. The following table lists the available ObjectExtensions and the associated ServiceProviderVisualizers.
Object Extension | Visualizer | Description |
|---|---|---|
The outline, interior and boundary wall of a surface region on an central body. | ||
The outline and boundary wall of a surface curve on an central body. | ||
A line drawn between the two end points of a link. | ||
A marker at the location of the object. | ||
A model at the location of the object. | ||
A point at the location of the object. | ||
Text at the location of the object. | ||
Ellipsoidal uncertainty in the position of an object. | ||
Sensor volumes and footprints projected onto a CentralBody. | ||
Renders an AzimuthElevationMask. | ||
Renders a ReferenceFrame. | ||
Renders a Vector. |
Picking allows users to select and interact with objects in the 3D scene. The pick method takes a normal Insight3D PickResult and returns the collection of service providers associated with the result.
List<PickResult> pickResults = getScene().pick(x, y);
for (PickResult pickResult : pickResults) {
    Iterable<IServiceProvider> pickedEntities = display.pick(pickResult);
}
Further examples showcasing various features of Platform Graphics can be found in the Insight3D HowTo application.